29
/
en
AIzaSyAYiBZKx7MnpbEhh9jyipgxe19OcubqV5w
April 1, 2024
66298
Algeria
DZA
true
2
1
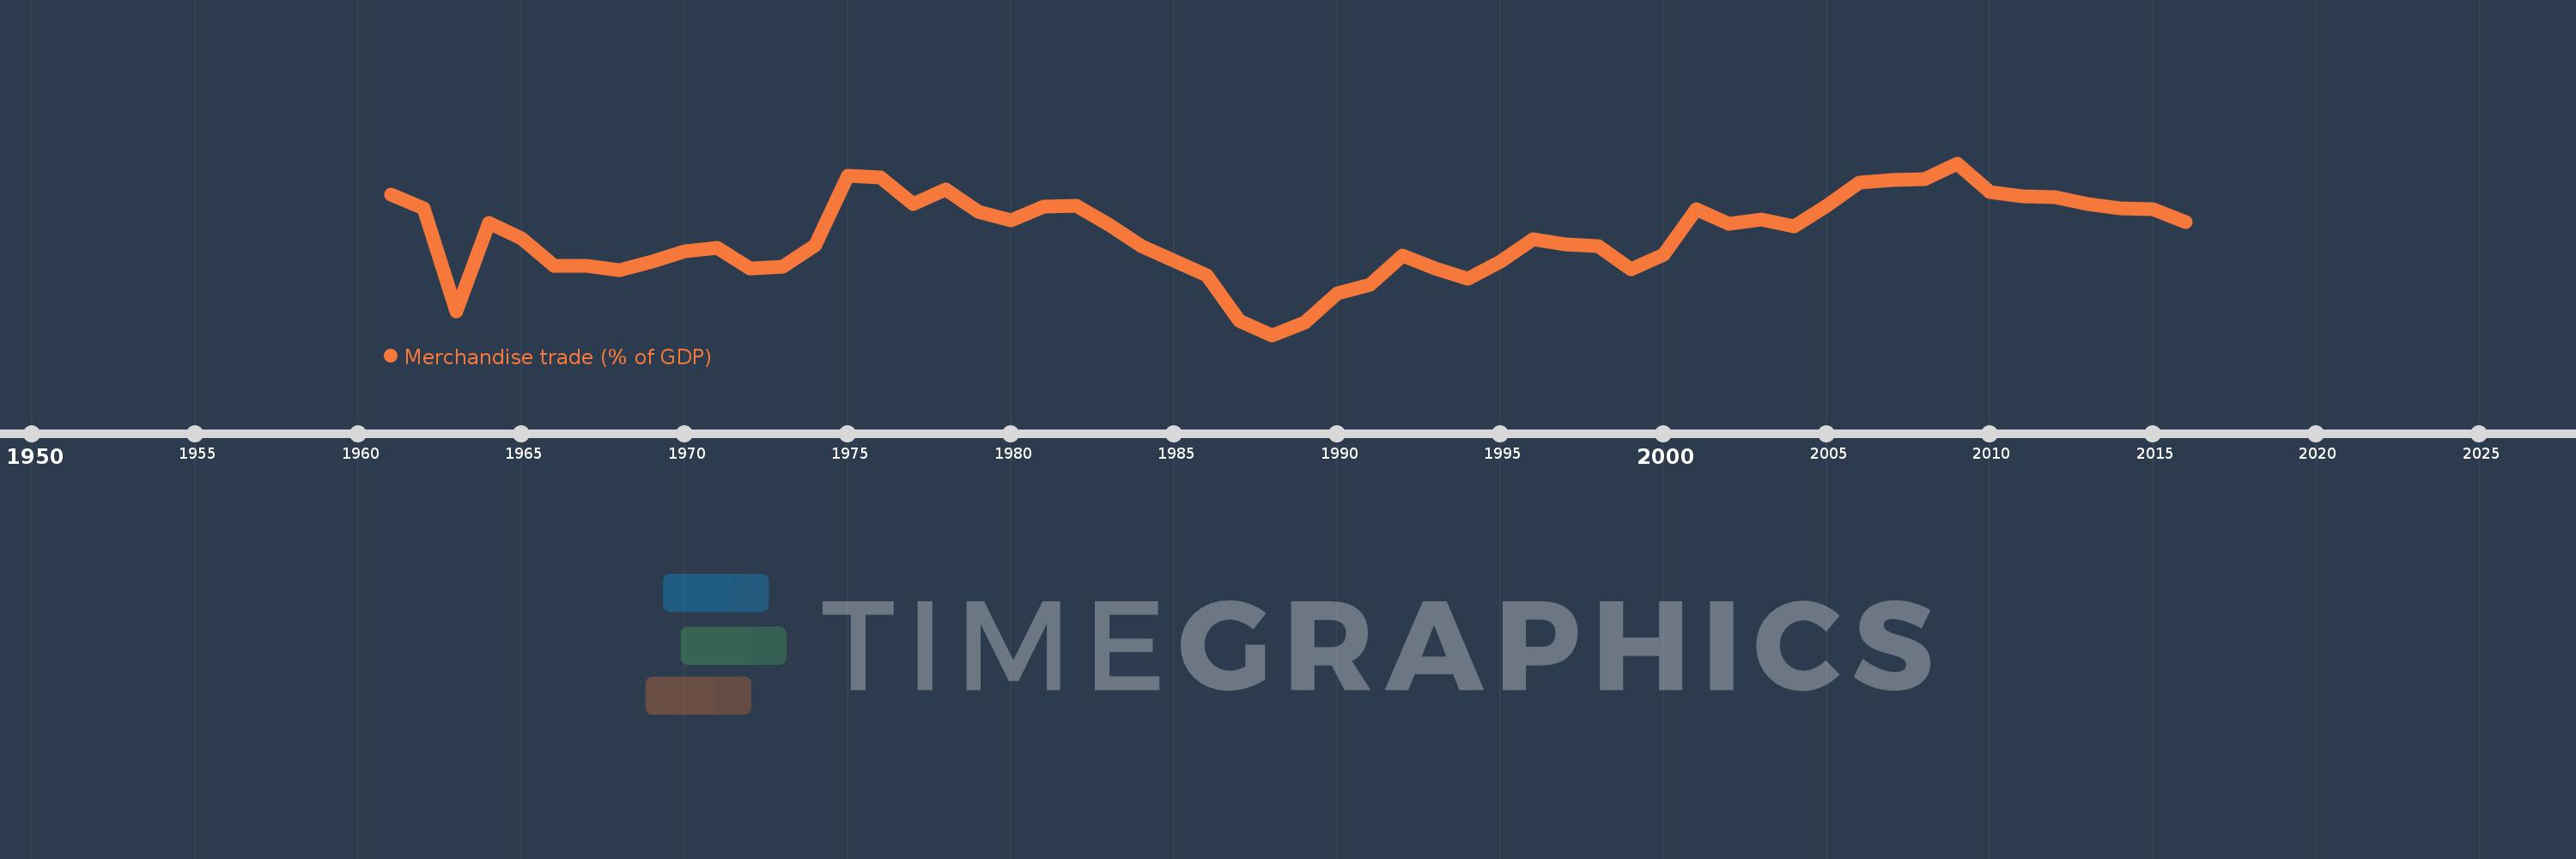
Merchandise trade (% of GDP)
2016,2015,2014,2013,2012,2011,2010,2009,2008,2007,2006,2005,2004,2003,2002,2001,2000,1999,1998,1997,1996,1995,1994,1993,1992,1991,1990,1989,1988,1987,1986,1985,1984,1983,1982,1981,1980,1979,1978,1977,1976,1975,1974,1973,1972,1971,1970,1969,1968,1967,1966,1965,1964,1963,1962,1961
This statistics in other country:
AfghanistanAlbaniaAlgeriaAngolaAntigua and BarbudaArab WorldArgentinaArmeniaArubaAustraliaAustriaAzerbaijanBahamas, TheBahrainBangladeshBarbadosBelarusBelgiumBelizeBeninBermudaBhutanBoliviaBosnia and HerzegovinaBotswanaBrazilBrunei DarussalamBulgariaBurkina FasoBurundiCabo VerdeCambodiaCameroonCanadaCaribbean small statesCentral African RepublicCentral Europe and the BalticsChadChileChinaColombiaComorosCongo, Dem. Rep.Congo, Rep.Costa RicaCote d'IvoireCroatiaCubaCyprusCzech RepublicDenmarkDjiboutiDominicaDominican RepublicEarly-demographic dividendEast Asia & PacificEast Asia & Pacific (excluding high income)East Asia & Pacific (IDA & IBRD countries)EcuadorEgypt, Arab Rep.El SalvadorEquatorial GuineaEritreaEstoniaEthiopiaEuro areaEurope & Central AsiaEurope & Central Asia (excluding high income)Europe & Central Asia (IDA & IBRD countries)European UnionFaroe IslandsFijiFinlandFragile and conflict affected situationsFranceFrench PolynesiaGabonGambia, TheGeorgiaGermanyGhanaGreeceGreenlandGrenadaGuatemalaGuineaGuinea-BissauGuyanaHaitiHeavily indebted poor countries (HIPC)High incomeHondurasHong Kong SAR, ChinaHungaryIBRD onlyIcelandIDA & IBRD totalIDA blendIDA onlyIDA totalIndiaIndonesiaIran, Islamic Rep.IraqIrelandIsraelItalyJamaicaJapanJordanKazakhstanKenyaKiribatiKorea, Rep.KuwaitKyrgyz RepublicLao PDRLate-demographic dividendLatin America & Caribbean Latin America & Caribbean (excluding high income)Latin America & the Caribbean (IDA & IBRD countries)LatviaLeast developed countries: UN classificationLebanonLesothoLiberiaLibyaLithuaniaLow & middle incomeLow incomeLower middle incomeLuxembourgMacao SAR, ChinaMacedonia, FYRMadagascarMalawiMalaysiaMaldivesMaliMaltaMarshall IslandsMauritaniaMauritiusMexicoMicronesia, Fed. Sts.Middle East & North AfricaMiddle East & North Africa (excluding high income)Middle East & North Africa (IDA & IBRD countries)Middle incomeMoldovaMongoliaMontenegroMoroccoMozambiqueMyanmarNamibiaNepalNetherlandsNew CaledoniaNew ZealandNicaraguaNigerNigeriaNorth AmericaNorwayOECD membersOmanOther small statesPacific island small statesPakistanPalauPanamaPapua New GuineaParaguayPeruPhilippinesPolandPortugalPost-demographic dividendPre-demographic dividendQatarRomaniaRussian FederationRwandaSamoaSao Tome and PrincipeSaudi ArabiaSenegalSerbiaSeychellesSierra LeoneSingaporeSlovak RepublicSloveniaSmall statesSolomon IslandsSouth AfricaSouth AsiaSouth Asia (IDA & IBRD)SpainSri LankaSt. Kitts and NevisSt. LuciaSt. Vincent and the GrenadinesSub-Saharan Africa Sub-Saharan Africa (excluding high income)Sub-Saharan Africa (IDA & IBRD countries)SudanSurinameSwazilandSwedenSwitzerlandSyrian Arab RepublicTajikistanTanzaniaThailandTimor-LesteTogoTongaTrinidad and TobagoTunisiaTurkeyTurkmenistanTuvaluUgandaUkraineUnited Arab EmiratesUnited KingdomUnited StatesUpper middle incomeUruguayUzbekistanVanuatuVenezuela, RBVietnamWorldYemen, Rep.ZambiaZimbabwe Timeline:
This timeline shows a graph from 1961 to 2016 of Algeria. No data until 1960. Number of actual observations by date: 56.
Source name:
World Development Indicators
Source organization:
World Trade Organization, and World Bank GDP estimates.
Categories, topics:
Private Sector, Trade
Last updated:
apr 23, 2017
Indicators value changes by year
Minimum:
22.875
jan 1, 1988
At the date of observation
Value
Absolute change
Change from previous value
jan 1, 1961
60.884
+60.884
0.0%
jan 1, 1962
57.144
-3.741
-6.14%
jan 1, 1963
29.217
-27.927
-48.87%
jan 1, 1964
53.339
+24.122
82.56%
jan 1, 1965
49.166
-4.173
-7.82%
jan 1, 1966
41.727
-7.439
-15.13%
jan 1, 1967
41.598
-0.129
-0.31%
jan 1, 1968
40.415
-1.183
-2.84%
jan 1, 1969
42.696
+2.28
5.64%
jan 1, 1970
45.641
+2.945
6.9%
jan 1, 1971
46.582
+0.941
2.06%
jan 1, 1972
41.038
-5.544
-11.9%
jan 1, 1973
41.383
+0.344
0.84%
jan 1, 1974
47.31
+5.928
14.32%
jan 1, 1975
66.027
+18.716
39.56%
jan 1, 1976
65.547
-0.48
-0.73%
jan 1, 1977
58.327
-7.22
-11.02%
jan 1, 1978
62.319
+3.992
6.84%
jan 1, 1979
56.415
-5.903
-9.47%
jan 1, 1980
54.006
-2.409
-4.27%
jan 1, 1981
57.69
+3.684
6.82%
jan 1, 1982
57.948
+0.258
0.45%
jan 1, 1983
52.921
-5.027
-8.67%
jan 1, 1984
47.093
-5.828
-11.01%
jan 1, 1985
42.986
-4.106
-8.72%
jan 1, 1986
39.149
-3.838
-8.93%
jan 1, 1987
26.783
-12.365
-31.59%
jan 1, 1988
22.875
-3.909
-14.59%
jan 1, 1989
26.232
+3.357
14.68%
jan 1, 1990
34.225
+7.994
30.47%
jan 1, 1991
36.602
+2.377
6.95%
jan 1, 1992
44.493
+7.89
21.56%
jan 1, 1993
40.997
-3.496
-7.86%
jan 1, 1994
38.071
-2.926
-7.14%
jan 1, 1995
42.898
+4.827
12.68%
jan 1, 1996
48.745
+5.847
13.63%
jan 1, 1997
47.527
-1.218
-2.5%
jan 1, 1998
46.872
-0.655
-1.38%
jan 1, 1999
40.693
-6.179
-13.18%
jan 1, 2000
44.586
+3.893
9.57%
jan 1, 2001
56.948
+12.362
27.73%
jan 1, 2002
53.106
-3.842
-6.75%
jan 1, 2003
54.207
+1.101
2.07%
jan 1, 2004
52.375
-1.833
-3.38%
jan 1, 2005
57.981
+5.607
10.71%
jan 1, 2006
64.303
+6.321
10.9%
jan 1, 2007
65.001
+0.698
1.09%
jan 1, 2008
65.044
+0.043
0.07%
jan 1, 2009
69.46
+4.416
6.79%
jan 1, 2010
61.561
-7.899
-11.37%
jan 1, 2011
60.497
-1.064
-1.73%
jan 1, 2012
60.364
-0.133
-0.22%
jan 1, 2013
58.477
-1.887
-3.13%
jan 1, 2014
57.225
-1.252
-2.14%
jan 1, 2015
56.888
-0.337
-0.59%
jan 1, 2016
53.518
-3.37
-5.92%
Ranking of countries by current statistics by years


Comments: