29
/
en
AIzaSyAYiBZKx7MnpbEhh9jyipgxe19OcubqV5w
April 1, 2024
122433
Dominican Republic
DOM
true
2
1
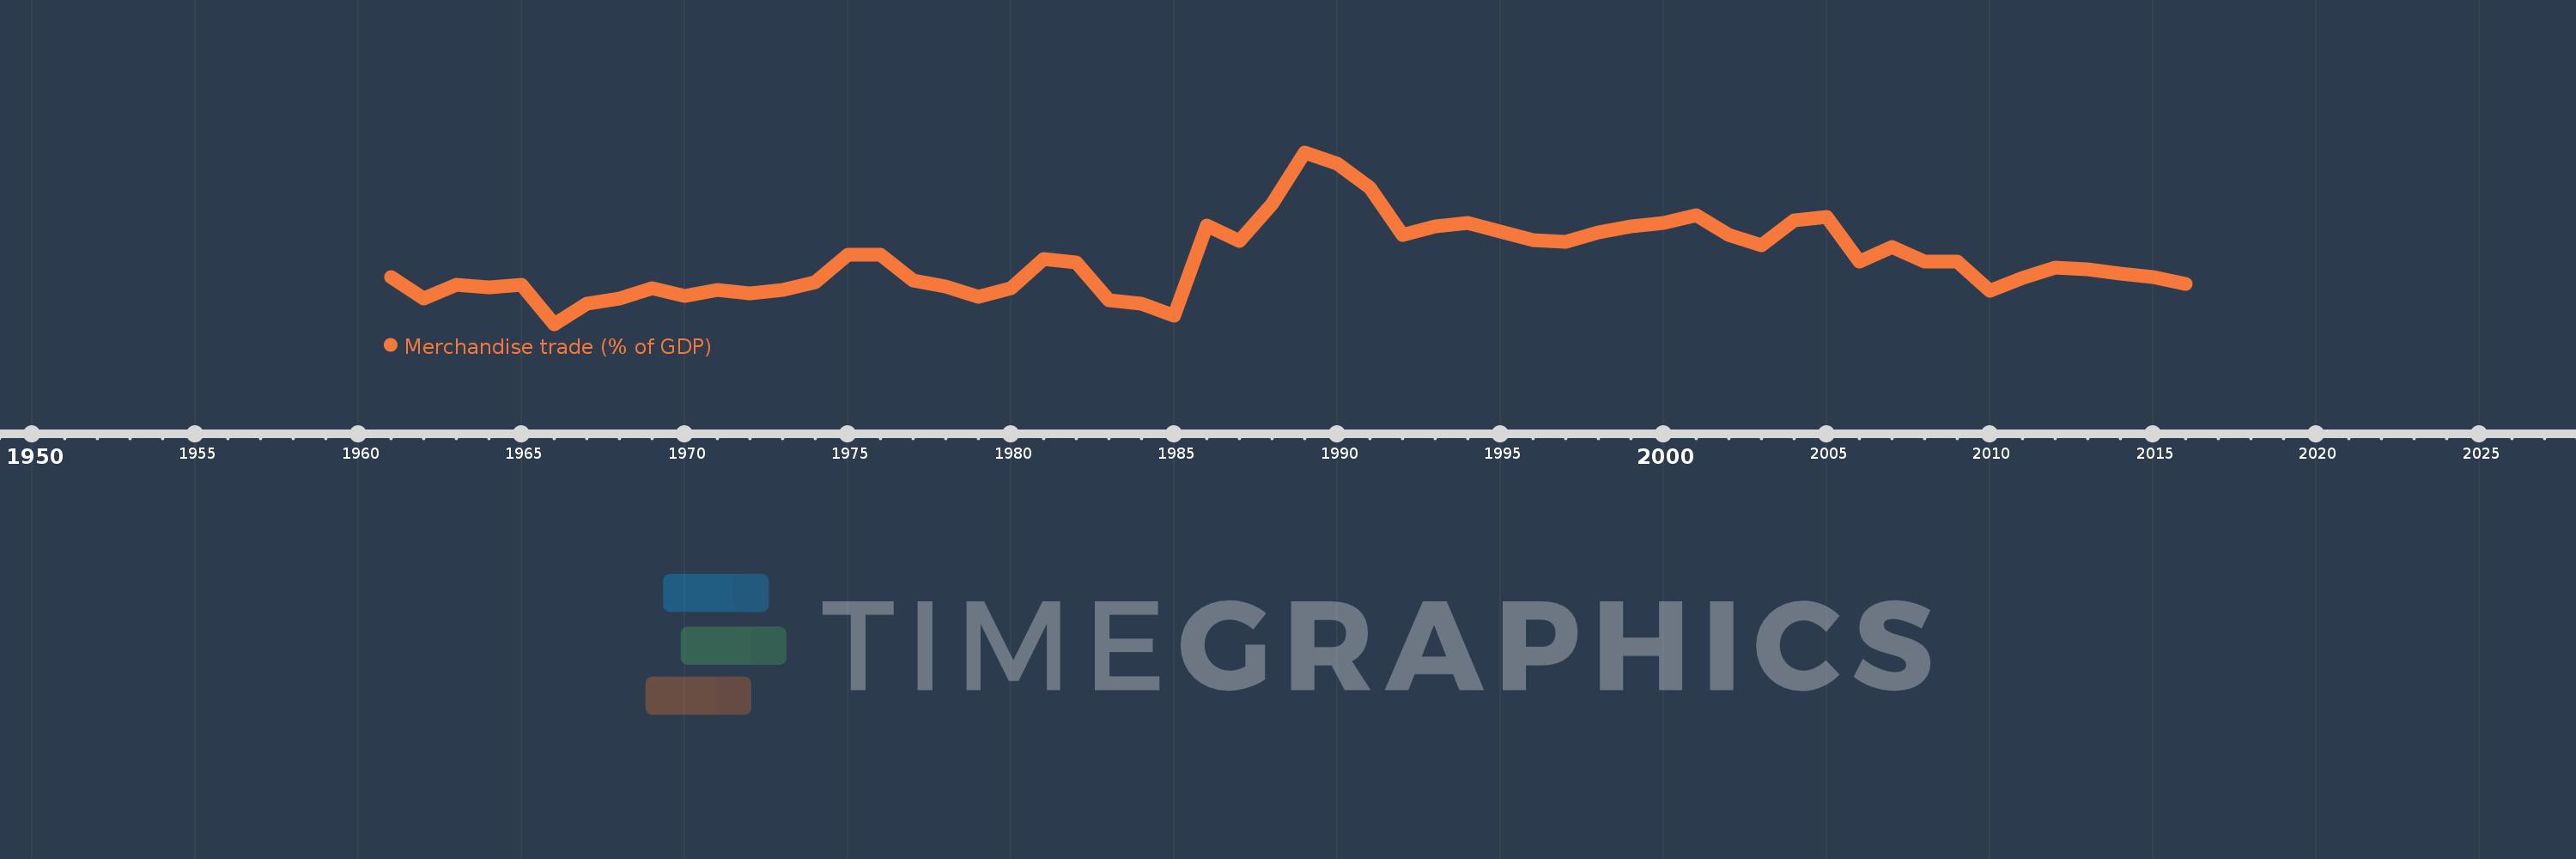
Merchandise trade (% of GDP)
2016,2015,2014,2013,2012,2011,2010,2009,2008,2007,2006,2005,2004,2003,2002,2001,2000,1999,1998,1997,1996,1995,1994,1993,1992,1991,1990,1989,1988,1987,1986,1985,1984,1983,1982,1981,1980,1979,1978,1977,1976,1975,1974,1973,1972,1971,1970,1969,1968,1967,1966,1965,1964,1963,1962,1961
This statistics in other country:
AfghanistanAlbaniaAlgeriaAngolaAntigua and BarbudaArab WorldArgentinaArmeniaArubaAustraliaAustriaAzerbaijanBahamas, TheBahrainBangladeshBarbadosBelarusBelgiumBelizeBeninBermudaBhutanBoliviaBosnia and HerzegovinaBotswanaBrazilBrunei DarussalamBulgariaBurkina FasoBurundiCabo VerdeCambodiaCameroonCanadaCaribbean small statesCentral African RepublicCentral Europe and the BalticsChadChileChinaColombiaComorosCongo, Dem. Rep.Congo, Rep.Costa RicaCote d'IvoireCroatiaCubaCyprusCzech RepublicDenmarkDjiboutiDominicaDominican RepublicEarly-demographic dividendEast Asia & PacificEast Asia & Pacific (excluding high income)East Asia & Pacific (IDA & IBRD countries)EcuadorEgypt, Arab Rep.El SalvadorEquatorial GuineaEritreaEstoniaEthiopiaEuro areaEurope & Central AsiaEurope & Central Asia (excluding high income)Europe & Central Asia (IDA & IBRD countries)European UnionFaroe IslandsFijiFinlandFragile and conflict affected situationsFranceFrench PolynesiaGabonGambia, TheGeorgiaGermanyGhanaGreeceGreenlandGrenadaGuatemalaGuineaGuinea-BissauGuyanaHaitiHeavily indebted poor countries (HIPC)High incomeHondurasHong Kong SAR, ChinaHungaryIBRD onlyIcelandIDA & IBRD totalIDA blendIDA onlyIDA totalIndiaIndonesiaIran, Islamic Rep.IraqIrelandIsraelItalyJamaicaJapanJordanKazakhstanKenyaKiribatiKorea, Rep.KuwaitKyrgyz RepublicLao PDRLate-demographic dividendLatin America & Caribbean Latin America & Caribbean (excluding high income)Latin America & the Caribbean (IDA & IBRD countries)LatviaLeast developed countries: UN classificationLebanonLesothoLiberiaLibyaLithuaniaLow & middle incomeLow incomeLower middle incomeLuxembourgMacao SAR, ChinaMacedonia, FYRMadagascarMalawiMalaysiaMaldivesMaliMaltaMarshall IslandsMauritaniaMauritiusMexicoMicronesia, Fed. Sts.Middle East & North AfricaMiddle East & North Africa (excluding high income)Middle East & North Africa (IDA & IBRD countries)Middle incomeMoldovaMongoliaMontenegroMoroccoMozambiqueMyanmarNamibiaNepalNetherlandsNew CaledoniaNew ZealandNicaraguaNigerNigeriaNorth AmericaNorwayOECD membersOmanOther small statesPacific island small statesPakistanPalauPanamaPapua New GuineaParaguayPeruPhilippinesPolandPortugalPost-demographic dividendPre-demographic dividendQatarRomaniaRussian FederationRwandaSamoaSao Tome and PrincipeSaudi ArabiaSenegalSerbiaSeychellesSierra LeoneSingaporeSlovak RepublicSloveniaSmall statesSolomon IslandsSouth AfricaSouth AsiaSouth Asia (IDA & IBRD)SpainSri LankaSt. Kitts and NevisSt. LuciaSt. Vincent and the GrenadinesSub-Saharan Africa Sub-Saharan Africa (excluding high income)Sub-Saharan Africa (IDA & IBRD countries)SudanSurinameSwazilandSwedenSwitzerlandSyrian Arab RepublicTajikistanTanzaniaThailandTimor-LesteTogoTongaTrinidad and TobagoTunisiaTurkeyTurkmenistanTuvaluUgandaUkraineUnited Arab EmiratesUnited KingdomUnited StatesUpper middle incomeUruguayUzbekistanVanuatuVenezuela, RBVietnamWorldYemen, Rep.ZambiaZimbabwe Timeline:
This timeline shows a graph from 1961 to 2016 of Dominican Republic. No data until 1960. Number of actual observations by date: 56.
Source name:
World Development Indicators
Source organization:
World Trade Organization, and World Bank GDP estimates.
Categories, topics:
Private Sector, Trade
Last updated:
apr 23, 2017
Indicators value changes by year
Maximum:
85.462
jan 1, 1989
At the date of observation
Value
Absolute change
Change from previous value
jan 1, 1961
41.704
+41.704
0.0%
jan 1, 1962
34.103
-7.602
-18.23%
jan 1, 1963
38.939
+4.836
14.18%
jan 1, 1964
38.11
-0.829
-2.13%
jan 1, 1965
39.062
+0.952
2.5%
jan 1, 1966
25.07
-13.991
-35.82%
jan 1, 1967
32.343
+7.272
29.01%
jan 1, 1968
34.157
+1.815
5.61%
jan 1, 1969
37.573
+3.416
10.0%
jan 1, 1970
34.982
-2.592
-6.9%
jan 1, 1971
37.245
+2.264
6.47%
jan 1, 1972
36.053
-1.192
-3.2%
jan 1, 1973
37.033
+0.98
2.72%
jan 1, 1974
39.728
+2.695
7.28%
jan 1, 1975
49.372
+9.644
24.28%
jan 1, 1976
49.521
+0.149
0.3%
jan 1, 1977
40.353
-9.168
-18.51%
jan 1, 1978
38.267
-2.086
-5.17%
jan 1, 1979
34.82
-3.446
-9.01%
jan 1, 1980
37.852
+3.031
8.71%
jan 1, 1981
47.972
+10.12
26.74%
jan 1, 1982
46.897
-1.075
-2.24%
jan 1, 1983
33.614
-13.283
-28.32%
jan 1, 1984
32.266
-1.347
-4.01%
jan 1, 1985
28.063
-4.203
-13.03%
jan 1, 1986
59.767
+31.704
112.98%
jan 1, 1987
54.245
-5.522
-9.24%
jan 1, 1988
67.222
+12.976
23.92%
jan 1, 1989
85.462
+18.24
27.13%
jan 1, 1990
81.611
-3.851
-4.51%
jan 1, 1991
73.173
-8.438
-10.34%
jan 1, 1992
56.59
-16.583
-22.66%
jan 1, 1993
59.321
+2.731
4.83%
jan 1, 1994
60.61
+1.289
2.17%
jan 1, 1995
57.583
-3.027
-4.99%
jan 1, 1996
54.712
-2.872
-4.99%
jan 1, 1997
53.938
-0.773
-1.41%
jan 1, 1998
57.278
+3.34
6.19%
jan 1, 1999
59.448
+2.17
3.79%
jan 1, 2000
60.701
+1.253
2.11%
jan 1, 2001
63.41
+2.709
4.46%
jan 1, 2002
56.463
-6.948
-10.96%
jan 1, 2003
52.699
-3.764
-6.67%
jan 1, 2004
61.559
+8.86
16.81%
jan 1, 2005
62.725
+1.166
1.89%
jan 1, 2006
47.094
-15.63
-24.92%
jan 1, 2007
52.245
+5.151
10.94%
jan 1, 2008
46.994
-5.251
-10.05%
jan 1, 2009
47.092
+0.098
0.21%
jan 1, 2010
36.751
-10.341
-21.96%
jan 1, 2011
41.225
+4.474
12.17%
jan 1, 2012
44.852
+3.627
8.8%
jan 1, 2013
44.228
-0.624
-1.39%
jan 1, 2014
42.804
-1.424
-3.22%
jan 1, 2015
41.71
-1.094
-2.56%
jan 1, 2016
39.132
-2.578
-6.18%
Ranking of countries by current statistics by years


Comments: