29
/
en
AIzaSyAYiBZKx7MnpbEhh9jyipgxe19OcubqV5w
April 1, 2024
134376
France
FRA
true
2
1
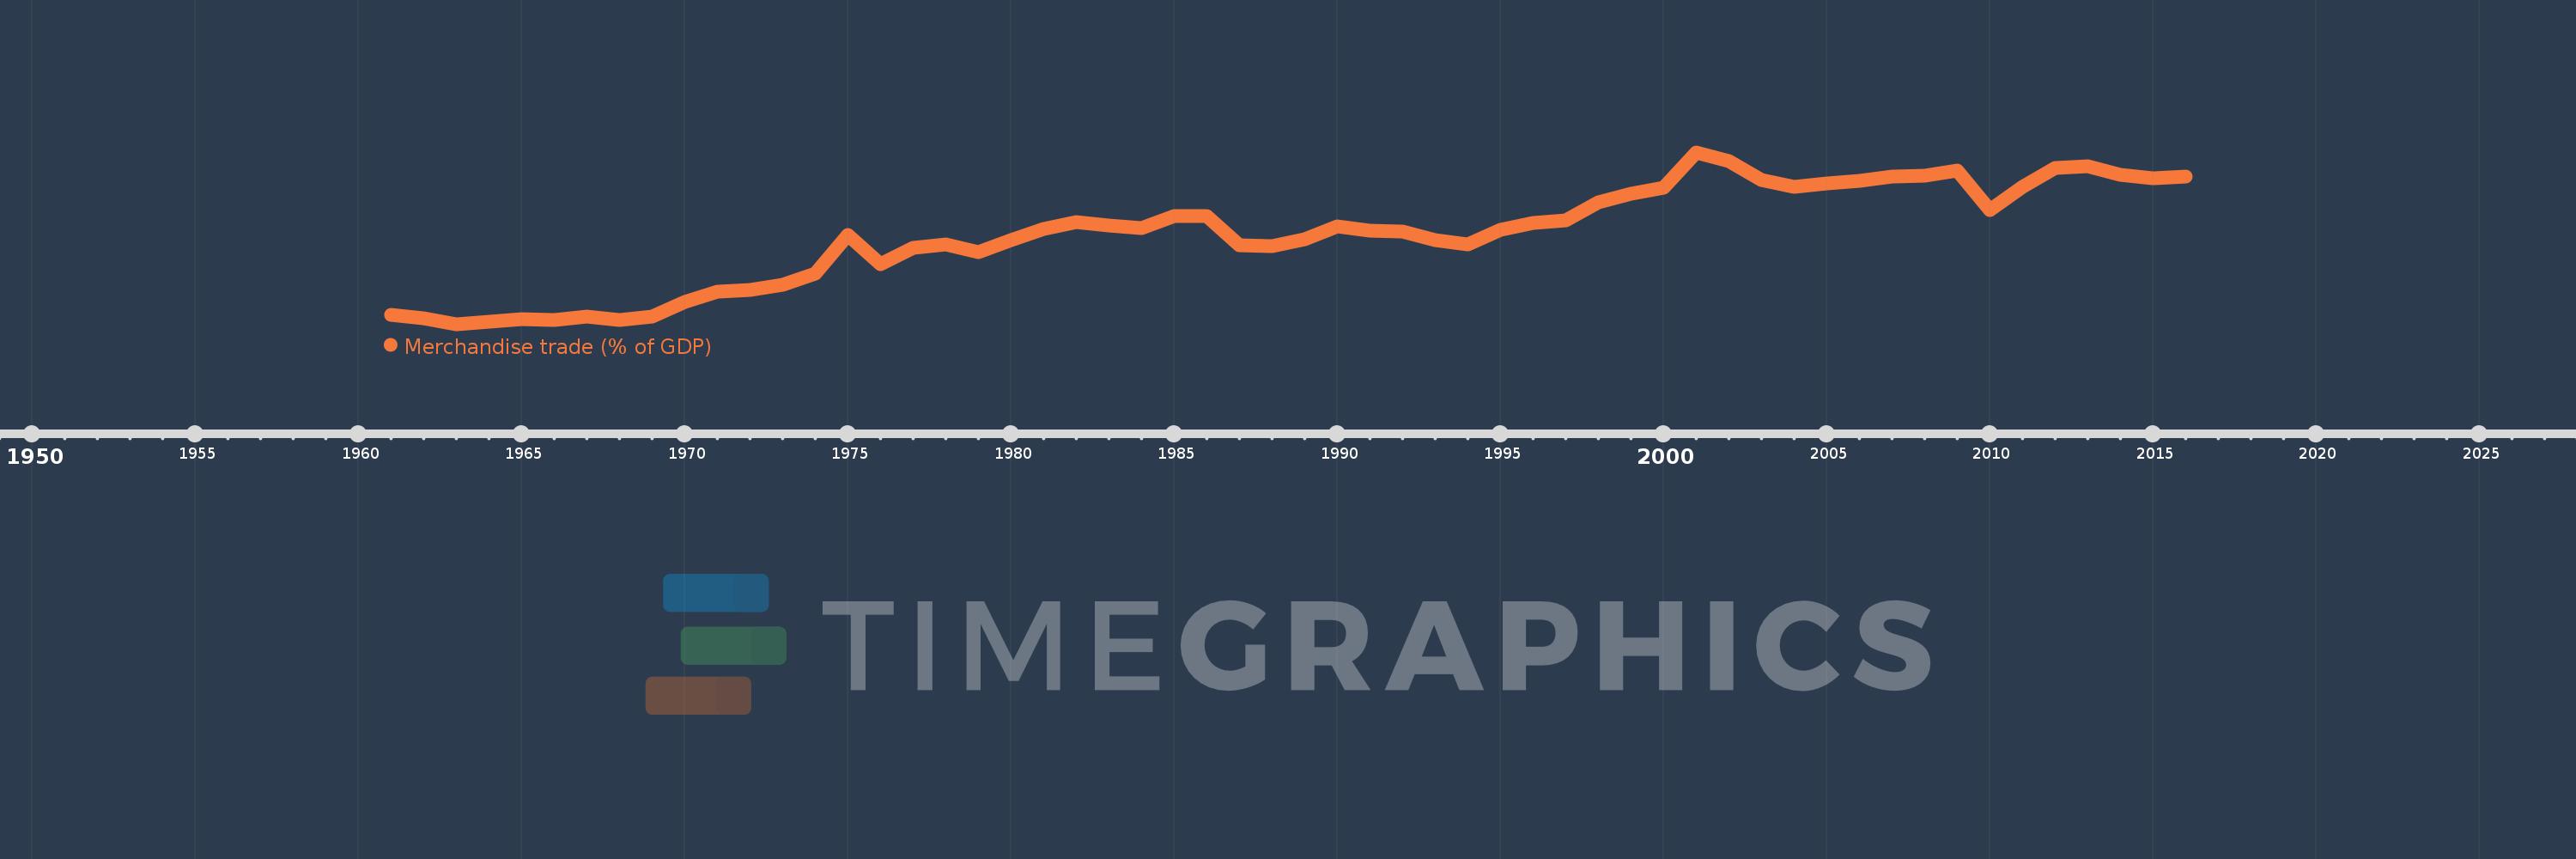
Merchandise trade (% of GDP)
2016,2015,2014,2013,2012,2011,2010,2009,2008,2007,2006,2005,2004,2003,2002,2001,2000,1999,1998,1997,1996,1995,1994,1993,1992,1991,1990,1989,1988,1987,1986,1985,1984,1983,1982,1981,1980,1979,1978,1977,1976,1975,1974,1973,1972,1971,1970,1969,1968,1967,1966,1965,1964,1963,1962,1961
This statistics in other country:
AfghanistanAlbaniaAlgeriaAngolaAntigua and BarbudaArab WorldArgentinaArmeniaArubaAustraliaAustriaAzerbaijanBahamas, TheBahrainBangladeshBarbadosBelarusBelgiumBelizeBeninBermudaBhutanBoliviaBosnia and HerzegovinaBotswanaBrazilBrunei DarussalamBulgariaBurkina FasoBurundiCabo VerdeCambodiaCameroonCanadaCaribbean small statesCentral African RepublicCentral Europe and the BalticsChadChileChinaColombiaComorosCongo, Dem. Rep.Congo, Rep.Costa RicaCote d'IvoireCroatiaCubaCyprusCzech RepublicDenmarkDjiboutiDominicaDominican RepublicEarly-demographic dividendEast Asia & PacificEast Asia & Pacific (excluding high income)East Asia & Pacific (IDA & IBRD countries)EcuadorEgypt, Arab Rep.El SalvadorEquatorial GuineaEritreaEstoniaEthiopiaEuro areaEurope & Central AsiaEurope & Central Asia (excluding high income)Europe & Central Asia (IDA & IBRD countries)European UnionFaroe IslandsFijiFinlandFragile and conflict affected situationsFranceFrench PolynesiaGabonGambia, TheGeorgiaGermanyGhanaGreeceGreenlandGrenadaGuatemalaGuineaGuinea-BissauGuyanaHaitiHeavily indebted poor countries (HIPC)High incomeHondurasHong Kong SAR, ChinaHungaryIBRD onlyIcelandIDA & IBRD totalIDA blendIDA onlyIDA totalIndiaIndonesiaIran, Islamic Rep.IraqIrelandIsraelItalyJamaicaJapanJordanKazakhstanKenyaKiribatiKorea, Rep.KuwaitKyrgyz RepublicLao PDRLate-demographic dividendLatin America & Caribbean Latin America & Caribbean (excluding high income)Latin America & the Caribbean (IDA & IBRD countries)LatviaLeast developed countries: UN classificationLebanonLesothoLiberiaLibyaLithuaniaLow & middle incomeLow incomeLower middle incomeLuxembourgMacao SAR, ChinaMacedonia, FYRMadagascarMalawiMalaysiaMaldivesMaliMaltaMarshall IslandsMauritaniaMauritiusMexicoMicronesia, Fed. Sts.Middle East & North AfricaMiddle East & North Africa (excluding high income)Middle East & North Africa (IDA & IBRD countries)Middle incomeMoldovaMongoliaMontenegroMoroccoMozambiqueMyanmarNamibiaNepalNetherlandsNew CaledoniaNew ZealandNicaraguaNigerNigeriaNorth AmericaNorwayOECD membersOmanOther small statesPacific island small statesPakistanPalauPanamaPapua New GuineaParaguayPeruPhilippinesPolandPortugalPost-demographic dividendPre-demographic dividendQatarRomaniaRussian FederationRwandaSamoaSao Tome and PrincipeSaudi ArabiaSenegalSerbiaSeychellesSierra LeoneSingaporeSlovak RepublicSloveniaSmall statesSolomon IslandsSouth AfricaSouth AsiaSouth Asia (IDA & IBRD)SpainSri LankaSt. Kitts and NevisSt. LuciaSt. Vincent and the GrenadinesSub-Saharan Africa Sub-Saharan Africa (excluding high income)Sub-Saharan Africa (IDA & IBRD countries)SudanSurinameSwazilandSwedenSwitzerlandSyrian Arab RepublicTajikistanTanzaniaThailandTimor-LesteTogoTongaTrinidad and TobagoTunisiaTurkeyTurkmenistanTuvaluUgandaUkraineUnited Arab EmiratesUnited KingdomUnited StatesUpper middle incomeUruguayUzbekistanVanuatuVenezuela, RBVietnamWorldYemen, Rep.ZambiaZimbabwe Timeline:
This timeline shows a graph from 1961 to 2016 of France. No data until 1960. Number of actual observations by date: 56.
Source name:
World Development Indicators
Source organization:
World Trade Organization, and World Bank GDP estimates.
Categories, topics:
Private Sector, Trade
Last updated:
apr 23, 2017
Indicators value changes by year
Maximum:
48.709
jan 1, 2001
At the date of observation
Value
Absolute change
Change from previous value
jan 1, 1961
20.987
+20.987
0.0%
jan 1, 1962
20.348
-0.64
-3.05%
jan 1, 1963
19.38
-0.968
-4.76%
jan 1, 1964
19.811
+0.431
2.22%
jan 1, 1965
20.237
+0.427
2.15%
jan 1, 1966
20.125
-0.112
-0.55%
jan 1, 1967
20.653
+0.527
2.62%
jan 1, 1968
20.081
-0.572
-2.77%
jan 1, 1969
20.733
+0.652
3.25%
jan 1, 1970
23.141
+2.408
11.61%
jan 1, 1971
24.995
+1.854
8.01%
jan 1, 1972
25.304
+0.309
1.23%
jan 1, 1973
26.164
+0.86
3.4%
jan 1, 1974
28.037
+1.874
7.16%
jan 1, 1975
34.614
+6.576
23.46%
jan 1, 1976
29.571
-5.043
-14.57%
jan 1, 1977
32.392
+2.821
9.54%
jan 1, 1978
32.996
+0.604
1.86%
jan 1, 1979
31.713
-1.283
-3.89%
jan 1, 1980
33.727
+2.014
6.35%
jan 1, 1981
35.663
+1.936
5.74%
jan 1, 1982
36.817
+1.154
3.24%
jan 1, 1983
36.195
-0.621
-1.69%
jan 1, 1984
35.748
-0.448
-1.24%
jan 1, 1985
37.91
+2.162
6.05%
jan 1, 1986
37.811
-0.099
-0.26%
jan 1, 1987
32.838
-4.973
-13.15%
jan 1, 1988
32.701
-0.137
-0.42%
jan 1, 1989
33.868
+1.167
3.57%
jan 1, 1990
36.149
+2.281
6.74%
jan 1, 1991
35.366
-0.783
-2.17%
jan 1, 1992
35.191
-0.175
-0.49%
jan 1, 1993
33.755
-1.436
-4.08%
jan 1, 1994
33.003
-0.752
-2.23%
jan 1, 1995
35.428
+2.425
7.35%
jan 1, 1996
36.683
+1.255
3.54%
jan 1, 1997
37.173
+0.491
1.34%
jan 1, 1998
40.198
+3.024
8.14%
jan 1, 1999
41.595
+1.397
3.48%
jan 1, 2000
42.744
+1.149
2.76%
jan 1, 2001
48.709
+5.965
13.96%
jan 1, 2002
47.17
-1.539
-3.16%
jan 1, 2003
44.056
-3.114
-6.6%
jan 1, 2004
42.794
-1.262
-2.86%
jan 1, 2005
43.456
+0.662
1.55%
jan 1, 2006
43.906
+0.45
1.04%
jan 1, 2007
44.636
+0.73
1.66%
jan 1, 2008
44.702
+0.067
0.15%
jan 1, 2009
45.598
+0.895
2.0%
jan 1, 2010
38.817
-6.781
-14.87%
jan 1, 2011
42.873
+4.056
10.45%
jan 1, 2012
45.991
+3.119
7.27%
jan 1, 2013
46.361
+0.369
0.8%
jan 1, 2014
44.95
-1.411
-3.04%
jan 1, 2015
44.276
-0.674
-1.5%
jan 1, 2016
44.59
+0.314
0.71%
Ranking of countries by current statistics by years


Comments: