29
/
en
AIzaSyAYiBZKx7MnpbEhh9jyipgxe19OcubqV5w
April 1, 2024
234895
Saudi Arabia
SAU
true
2
1
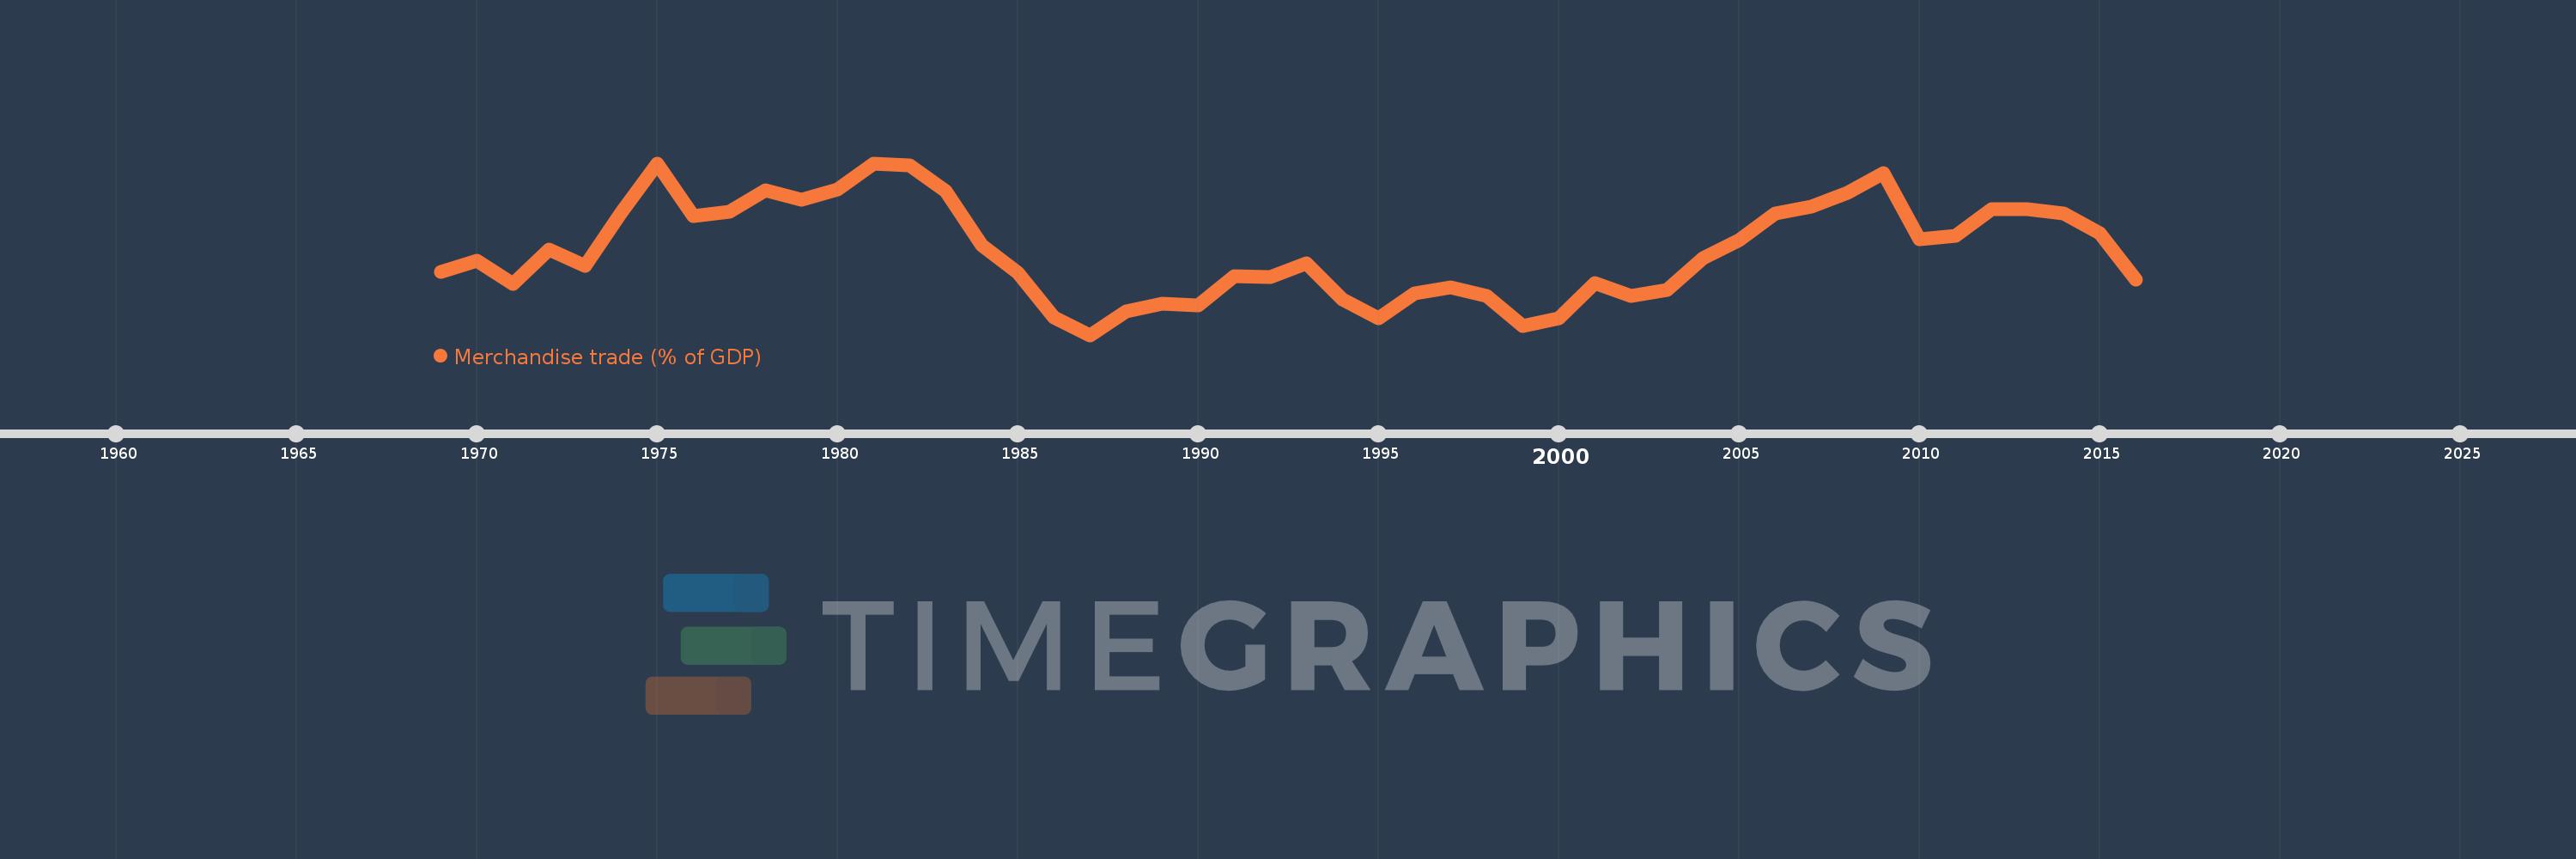
Merchandise trade (% of GDP)
2016,2015,2014,2013,2012,2011,2010,2009,2008,2007,2006,2005,2004,2003,2002,2001,2000,1999,1998,1997,1996,1995,1994,1993,1992,1991,1990,1989,1988,1987,1986,1985,1984,1983,1982,1981,1980,1979,1978,1977,1976,1975,1974,1973,1972,1971,1970,1969
This statistics in other country:
AfghanistanAlbaniaAlgeriaAngolaAntigua and BarbudaArab WorldArgentinaArmeniaArubaAustraliaAustriaAzerbaijanBahamas, TheBahrainBangladeshBarbadosBelarusBelgiumBelizeBeninBermudaBhutanBoliviaBosnia and HerzegovinaBotswanaBrazilBrunei DarussalamBulgariaBurkina FasoBurundiCabo VerdeCambodiaCameroonCanadaCaribbean small statesCentral African RepublicCentral Europe and the BalticsChadChileChinaColombiaComorosCongo, Dem. Rep.Congo, Rep.Costa RicaCote d'IvoireCroatiaCubaCyprusCzech RepublicDenmarkDjiboutiDominicaDominican RepublicEarly-demographic dividendEast Asia & PacificEast Asia & Pacific (excluding high income)East Asia & Pacific (IDA & IBRD countries)EcuadorEgypt, Arab Rep.El SalvadorEquatorial GuineaEritreaEstoniaEthiopiaEuro areaEurope & Central AsiaEurope & Central Asia (excluding high income)Europe & Central Asia (IDA & IBRD countries)European UnionFaroe IslandsFijiFinlandFragile and conflict affected situationsFranceFrench PolynesiaGabonGambia, TheGeorgiaGermanyGhanaGreeceGreenlandGrenadaGuatemalaGuineaGuinea-BissauGuyanaHaitiHeavily indebted poor countries (HIPC)High incomeHondurasHong Kong SAR, ChinaHungaryIBRD onlyIcelandIDA & IBRD totalIDA blendIDA onlyIDA totalIndiaIndonesiaIran, Islamic Rep.IraqIrelandIsraelItalyJamaicaJapanJordanKazakhstanKenyaKiribatiKorea, Rep.KuwaitKyrgyz RepublicLao PDRLate-demographic dividendLatin America & Caribbean Latin America & Caribbean (excluding high income)Latin America & the Caribbean (IDA & IBRD countries)LatviaLeast developed countries: UN classificationLebanonLesothoLiberiaLibyaLithuaniaLow & middle incomeLow incomeLower middle incomeLuxembourgMacao SAR, ChinaMacedonia, FYRMadagascarMalawiMalaysiaMaldivesMaliMaltaMarshall IslandsMauritaniaMauritiusMexicoMicronesia, Fed. Sts.Middle East & North AfricaMiddle East & North Africa (excluding high income)Middle East & North Africa (IDA & IBRD countries)Middle incomeMoldovaMongoliaMontenegroMoroccoMozambiqueMyanmarNamibiaNepalNetherlandsNew CaledoniaNew ZealandNicaraguaNigerNigeriaNorth AmericaNorwayOECD membersOmanOther small statesPacific island small statesPakistanPalauPanamaPapua New GuineaParaguayPeruPhilippinesPolandPortugalPost-demographic dividendPre-demographic dividendQatarRomaniaRussian FederationRwandaSamoaSao Tome and PrincipeSaudi ArabiaSenegalSerbiaSeychellesSierra LeoneSingaporeSlovak RepublicSloveniaSmall statesSolomon IslandsSouth AfricaSouth AsiaSouth Asia (IDA & IBRD)SpainSri LankaSt. Kitts and NevisSt. LuciaSt. Vincent and the GrenadinesSub-Saharan Africa Sub-Saharan Africa (excluding high income)Sub-Saharan Africa (IDA & IBRD countries)SudanSurinameSwazilandSwedenSwitzerlandSyrian Arab RepublicTajikistanTanzaniaThailandTimor-LesteTogoTongaTrinidad and TobagoTunisiaTurkeyTurkmenistanTuvaluUgandaUkraineUnited Arab EmiratesUnited KingdomUnited StatesUpper middle incomeUruguayUzbekistanVanuatuVenezuela, RBVietnamWorldYemen, Rep.ZambiaZimbabwe Timeline:
This timeline shows a graph from 1969 to 2016 of Saudi Arabia. No data until 1968. Number of actual observations by date: 48.
Source name:
World Development Indicators
Source organization:
World Trade Organization, and World Bank GDP estimates.
Categories, topics:
Private Sector, Trade
Last updated:
apr 23, 2017
Indicators value changes by year
Minimum:
45.189
jan 1, 1987
Maximum:
84.628
jan 1, 1981
At the date of observation
Value
Absolute change
Change from previous value
jan 1, 1969
59.639
+59.639
0.0%
jan 1, 1970
62.152
+2.513
4.21%
jan 1, 1971
56.98
-5.172
-8.32%
jan 1, 1972
64.838
+7.859
13.79%
jan 1, 1973
61.135
-3.703
-5.71%
jan 1, 1974
73.323
+12.188
19.94%
jan 1, 1975
84.59
+11.266
15.37%
jan 1, 1976
72.448
-12.141
-14.35%
jan 1, 1977
73.401
+0.953
1.31%
jan 1, 1978
78.343
+4.942
6.73%
jan 1, 1979
76.192
-2.151
-2.75%
jan 1, 1980
78.571
+2.379
3.12%
jan 1, 1981
84.628
+6.058
7.71%
jan 1, 1982
84.184
-0.444
-0.52%
jan 1, 1983
78.127
-6.057
-7.2%
jan 1, 1984
65.849
-12.278
-15.72%
jan 1, 1985
59.554
-6.295
-9.56%
jan 1, 1986
49.186
-10.368
-17.41%
jan 1, 1987
45.189
-3.997
-8.13%
jan 1, 1988
50.538
+5.349
11.84%
jan 1, 1989
52.303
+1.765
3.49%
jan 1, 1990
51.955
-0.349
-0.67%
jan 1, 1991
58.646
+6.691
12.88%
jan 1, 1992
58.534
-0.112
-0.19%
jan 1, 1993
61.611
+3.077
5.26%
jan 1, 1994
53.418
-8.192
-13.3%
jan 1, 1995
49.098
-4.32
-8.09%
jan 1, 1996
54.845
+5.747
11.71%
jan 1, 1997
56.087
+1.242
2.26%
jan 1, 1998
54.223
-1.864
-3.32%
jan 1, 1999
47.221
-7.002
-12.91%
jan 1, 2000
48.94
+1.719
3.64%
jan 1, 2001
57.217
+8.277
16.91%
jan 1, 2002
54.252
-2.966
-5.18%
jan 1, 2003
55.553
+1.302
2.4%
jan 1, 2004
62.892
+7.339
13.21%
jan 1, 2005
67.006
+4.114
6.54%
jan 1, 2006
73.12
+6.114
9.12%
jan 1, 2007
74.583
+1.463
2.0%
jan 1, 2008
77.781
+3.198
4.29%
jan 1, 2009
82.455
+4.673
6.01%
jan 1, 2010
67.086
-15.368
-18.64%
jan 1, 2011
67.957
+0.871
1.3%
jan 1, 2012
74.127
+6.17
9.08%
jan 1, 2013
74.118
-0.009
-0.01%
jan 1, 2014
73.089
-1.029
-1.39%
jan 1, 2015
68.468
-4.621
-6.32%
jan 1, 2016
57.893
-10.575
-15.44%
Ranking of countries by current statistics by years


Comments: