29
/
en
AIzaSyAYiBZKx7MnpbEhh9jyipgxe19OcubqV5w
April 1, 2024
133411
Finland
FIN
true
2
1
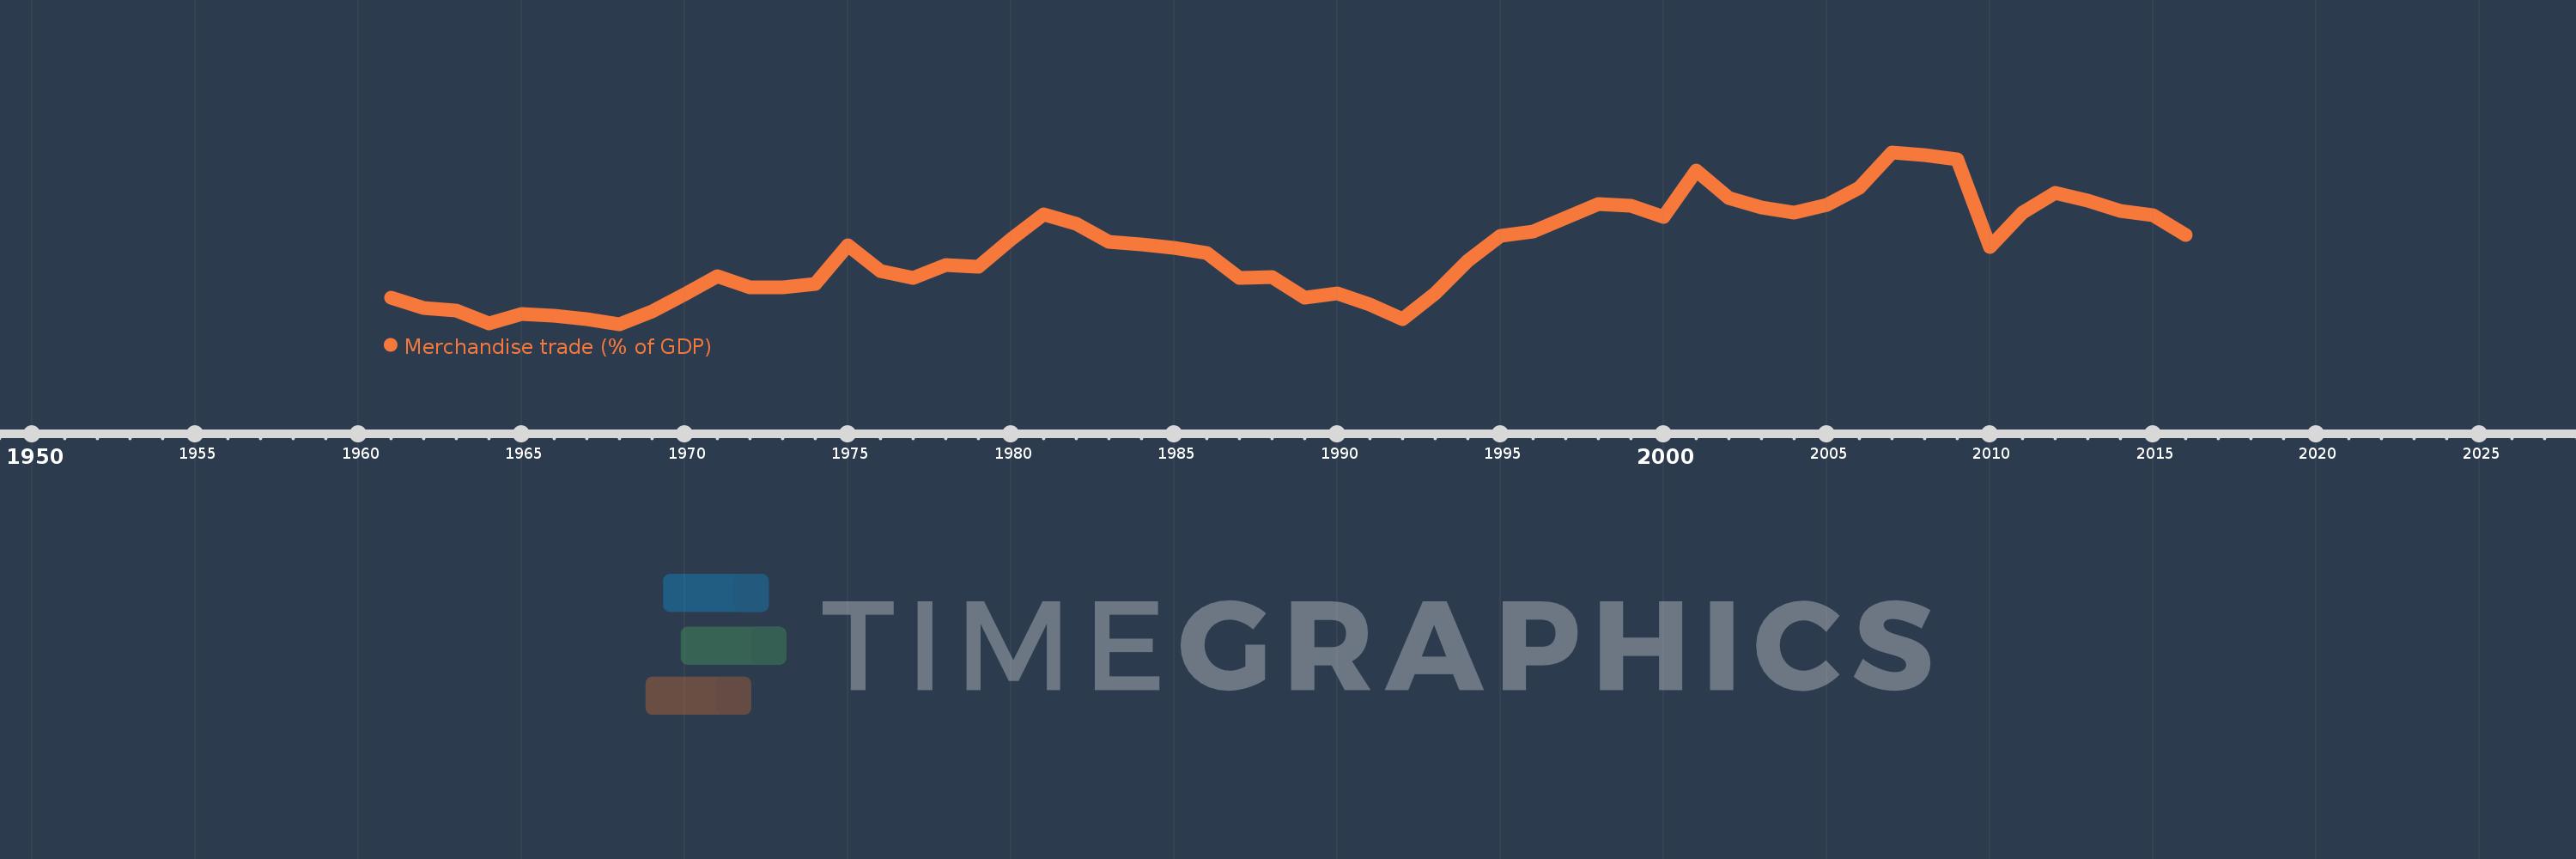
Merchandise trade (% of GDP)
2016,2015,2014,2013,2012,2011,2010,2009,2008,2007,2006,2005,2004,2003,2002,2001,2000,1999,1998,1997,1996,1995,1994,1993,1992,1991,1990,1989,1988,1987,1986,1985,1984,1983,1982,1981,1980,1979,1978,1977,1976,1975,1974,1973,1972,1971,1970,1969,1968,1967,1966,1965,1964,1963,1962,1961
This statistics in other country:
AfghanistanAlbaniaAlgeriaAngolaAntigua and BarbudaArab WorldArgentinaArmeniaArubaAustraliaAustriaAzerbaijanBahamas, TheBahrainBangladeshBarbadosBelarusBelgiumBelizeBeninBermudaBhutanBoliviaBosnia and HerzegovinaBotswanaBrazilBrunei DarussalamBulgariaBurkina FasoBurundiCabo VerdeCambodiaCameroonCanadaCaribbean small statesCentral African RepublicCentral Europe and the BalticsChadChileChinaColombiaComorosCongo, Dem. Rep.Congo, Rep.Costa RicaCote d'IvoireCroatiaCubaCyprusCzech RepublicDenmarkDjiboutiDominicaDominican RepublicEarly-demographic dividendEast Asia & PacificEast Asia & Pacific (excluding high income)East Asia & Pacific (IDA & IBRD countries)EcuadorEgypt, Arab Rep.El SalvadorEquatorial GuineaEritreaEstoniaEthiopiaEuro areaEurope & Central AsiaEurope & Central Asia (excluding high income)Europe & Central Asia (IDA & IBRD countries)European UnionFaroe IslandsFijiFinlandFragile and conflict affected situationsFranceFrench PolynesiaGabonGambia, TheGeorgiaGermanyGhanaGreeceGreenlandGrenadaGuatemalaGuineaGuinea-BissauGuyanaHaitiHeavily indebted poor countries (HIPC)High incomeHondurasHong Kong SAR, ChinaHungaryIBRD onlyIcelandIDA & IBRD totalIDA blendIDA onlyIDA totalIndiaIndonesiaIran, Islamic Rep.IraqIrelandIsraelItalyJamaicaJapanJordanKazakhstanKenyaKiribatiKorea, Rep.KuwaitKyrgyz RepublicLao PDRLate-demographic dividendLatin America & Caribbean Latin America & Caribbean (excluding high income)Latin America & the Caribbean (IDA & IBRD countries)LatviaLeast developed countries: UN classificationLebanonLesothoLiberiaLibyaLithuaniaLow & middle incomeLow incomeLower middle incomeLuxembourgMacao SAR, ChinaMacedonia, FYRMadagascarMalawiMalaysiaMaldivesMaliMaltaMarshall IslandsMauritaniaMauritiusMexicoMicronesia, Fed. Sts.Middle East & North AfricaMiddle East & North Africa (excluding high income)Middle East & North Africa (IDA & IBRD countries)Middle incomeMoldovaMongoliaMontenegroMoroccoMozambiqueMyanmarNamibiaNepalNetherlandsNew CaledoniaNew ZealandNicaraguaNigerNigeriaNorth AmericaNorwayOECD membersOmanOther small statesPacific island small statesPakistanPalauPanamaPapua New GuineaParaguayPeruPhilippinesPolandPortugalPost-demographic dividendPre-demographic dividendQatarRomaniaRussian FederationRwandaSamoaSao Tome and PrincipeSaudi ArabiaSenegalSerbiaSeychellesSierra LeoneSingaporeSlovak RepublicSloveniaSmall statesSolomon IslandsSouth AfricaSouth AsiaSouth Asia (IDA & IBRD)SpainSri LankaSt. Kitts and NevisSt. LuciaSt. Vincent and the GrenadinesSub-Saharan Africa Sub-Saharan Africa (excluding high income)Sub-Saharan Africa (IDA & IBRD countries)SudanSurinameSwazilandSwedenSwitzerlandSyrian Arab RepublicTajikistanTanzaniaThailandTimor-LesteTogoTongaTrinidad and TobagoTunisiaTurkeyTurkmenistanTuvaluUgandaUkraineUnited Arab EmiratesUnited KingdomUnited StatesUpper middle incomeUruguayUzbekistanVanuatuVenezuela, RBVietnamWorldYemen, Rep.ZambiaZimbabwe Timeline:
This timeline shows a graph from 1961 to 2016 of Finland. No data until 1960. Number of actual observations by date: 56.
Source name:
World Development Indicators
Source organization:
World Trade Organization, and World Bank GDP estimates.
Categories, topics:
Private Sector, Trade
Last updated:
apr 23, 2017
Indicators value changes by year
Maximum:
67.688
jan 1, 2007
At the date of observation
Value
Absolute change
Change from previous value
jan 1, 1961
39.295
+39.295
0.0%
jan 1, 1962
37.289
-2.006
-5.11%
jan 1, 1963
36.772
-0.517
-1.39%
jan 1, 1964
34.236
-2.536
-6.9%
jan 1, 1965
35.999
+1.763
5.15%
jan 1, 1966
35.767
-0.232
-0.64%
jan 1, 1967
35.093
-0.674
-1.89%
jan 1, 1968
34.04
-1.053
-3.0%
jan 1, 1969
36.582
+2.542
7.47%
jan 1, 1970
39.84
+3.258
8.91%
jan 1, 1971
43.499
+3.659
9.19%
jan 1, 1972
41.268
-2.231
-5.13%
jan 1, 1973
41.199
-0.069
-0.17%
jan 1, 1974
41.971
+0.772
1.87%
jan 1, 1975
49.474
+7.503
17.88%
jan 1, 1976
44.519
-4.955
-10.02%
jan 1, 1977
43.088
-1.431
-3.21%
jan 1, 1978
45.556
+2.468
5.73%
jan 1, 1979
45.3
-0.255
-0.56%
jan 1, 1980
50.722
+5.422
11.97%
jan 1, 1981
55.481
+4.759
9.38%
jan 1, 1982
53.723
-1.758
-3.17%
jan 1, 1983
50.138
-3.585
-6.67%
jan 1, 1984
49.68
-0.458
-0.91%
jan 1, 1985
48.945
-0.735
-1.48%
jan 1, 1986
48.018
-0.927
-1.89%
jan 1, 1987
43.072
-4.947
-10.3%
jan 1, 1988
43.289
+0.217
0.5%
jan 1, 1989
39.3
-3.989
-9.21%
jan 1, 1990
40.091
+0.79
2.01%
jan 1, 1991
37.855
-2.235
-5.58%
jan 1, 1992
35.106
-2.749
-7.26%
jan 1, 1993
40.123
+5.017
14.29%
jan 1, 1994
46.528
+6.405
15.96%
jan 1, 1995
51.275
+4.747
10.2%
jan 1, 1996
52.131
+0.857
1.67%
jan 1, 1997
54.918
+2.786
5.34%
jan 1, 1998
57.621
+2.703
4.92%
jan 1, 1999
57.275
-0.345
-0.6%
jan 1, 2000
54.988
-2.288
-3.99%
jan 1, 2001
64.159
+9.171
16.68%
jan 1, 2002
58.705
-5.454
-8.5%
jan 1, 2003
56.87
-1.835
-3.13%
jan 1, 2004
55.932
-0.937
-1.65%
jan 1, 2005
57.409
+1.477
2.64%
jan 1, 2006
60.784
+3.374
5.88%
jan 1, 2007
67.688
+6.905
11.36%
jan 1, 2008
67.243
-0.445
-0.66%
jan 1, 2009
66.341
-0.902
-1.34%
jan 1, 2010
49.203
-17.138
-25.83%
jan 1, 2011
55.816
+6.614
13.44%
jan 1, 2012
59.712
+3.896
6.98%
jan 1, 2013
58.255
-1.457
-2.44%
jan 1, 2014
56.303
-1.952
-3.35%
jan 1, 2015
55.46
-0.843
-1.5%
jan 1, 2016
51.534
-3.925
-7.08%
Ranking of countries by current statistics by years


Comments: