29
/
en
AIzaSyAYiBZKx7MnpbEhh9jyipgxe19OcubqV5w
April 1, 2024
70114
Argentina
ARG
true
2
1
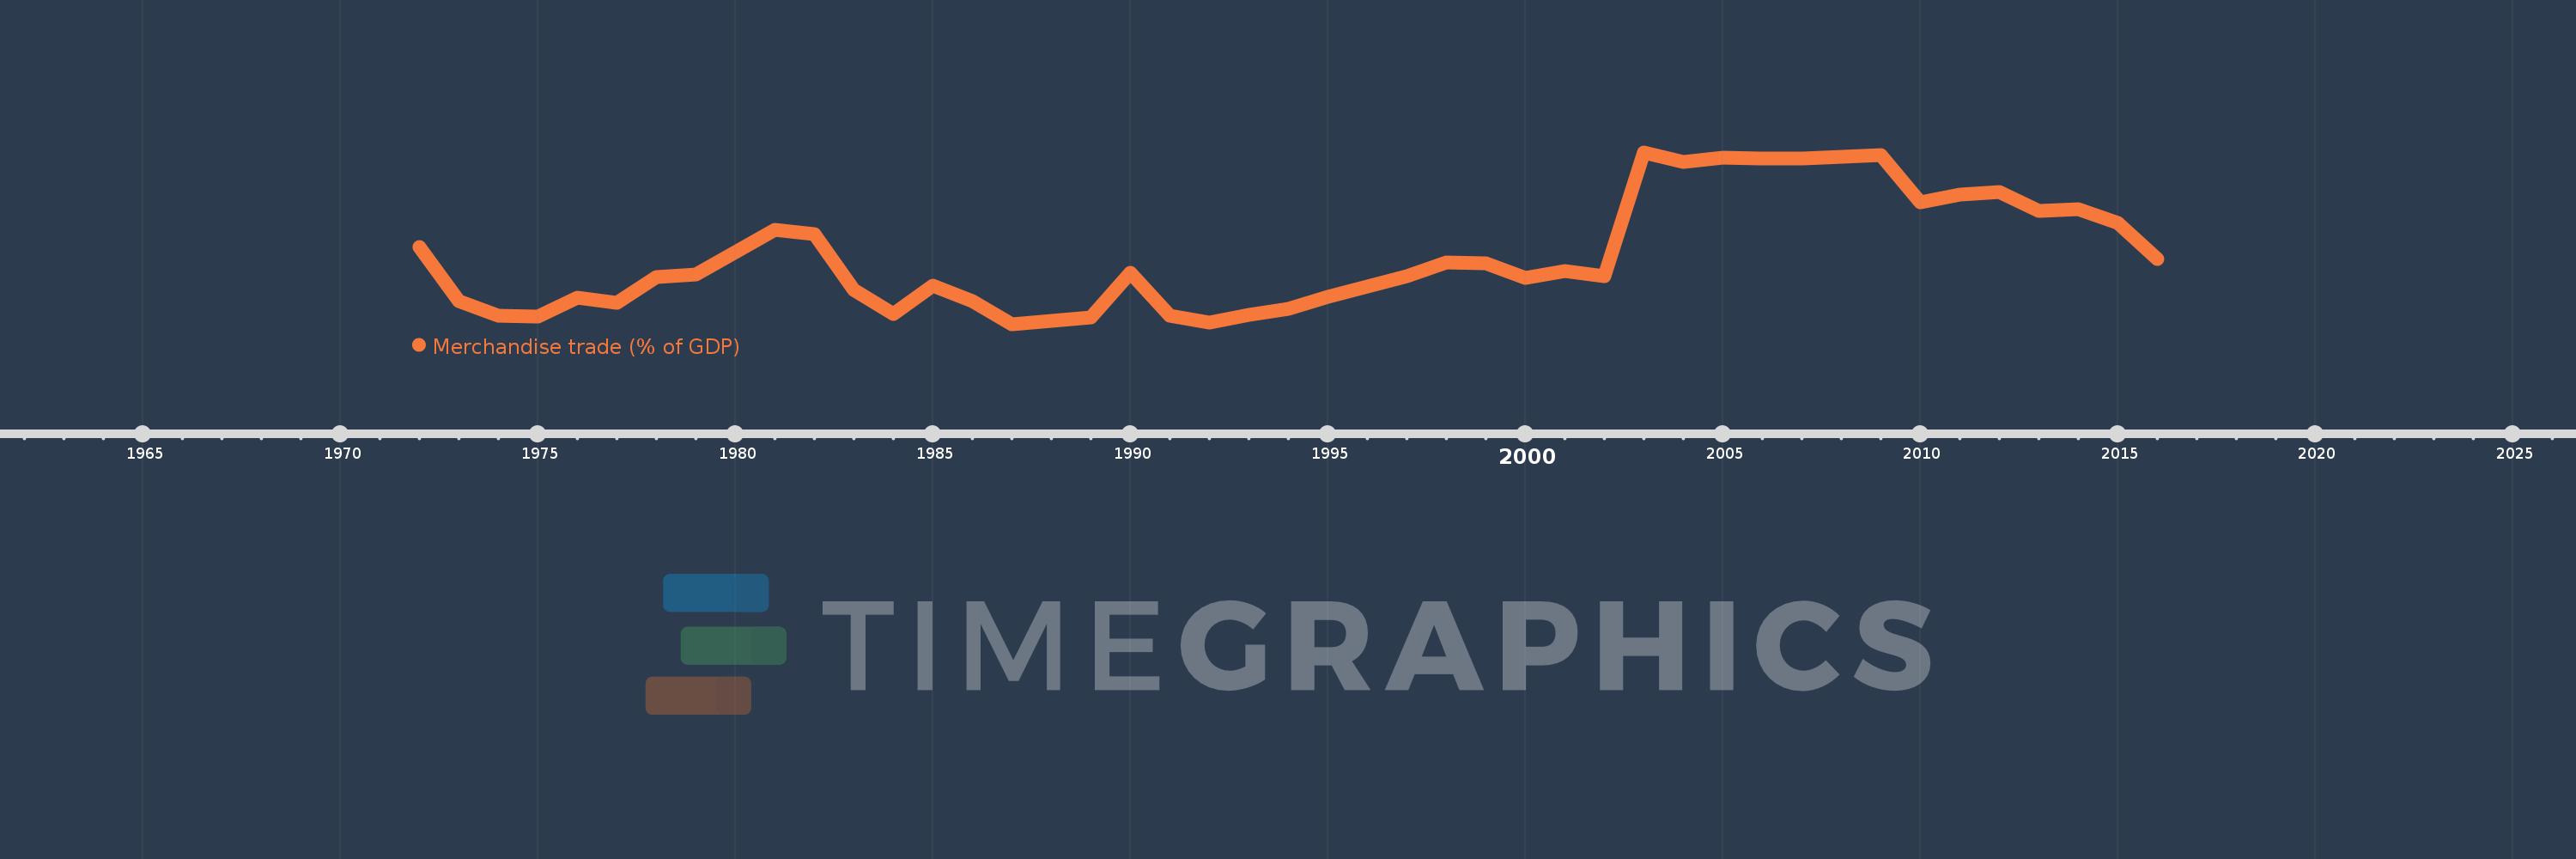
Merchandise trade (% of GDP)
2016,2015,2014,2013,2012,2011,2010,2009,2008,2007,2006,2005,2004,2003,2002,2001,2000,1999,1998,1997,1996,1995,1994,1993,1992,1991,1990,1989,1988,1987,1986,1985,1984,1983,1982,1981,1980,1979,1978,1977,1976,1975,1974,1973,1972
This statistics in other country:
AfghanistanAlbaniaAlgeriaAngolaAntigua and BarbudaArab WorldArgentinaArmeniaArubaAustraliaAustriaAzerbaijanBahamas, TheBahrainBangladeshBarbadosBelarusBelgiumBelizeBeninBermudaBhutanBoliviaBosnia and HerzegovinaBotswanaBrazilBrunei DarussalamBulgariaBurkina FasoBurundiCabo VerdeCambodiaCameroonCanadaCaribbean small statesCentral African RepublicCentral Europe and the BalticsChadChileChinaColombiaComorosCongo, Dem. Rep.Congo, Rep.Costa RicaCote d'IvoireCroatiaCubaCyprusCzech RepublicDenmarkDjiboutiDominicaDominican RepublicEarly-demographic dividendEast Asia & PacificEast Asia & Pacific (excluding high income)East Asia & Pacific (IDA & IBRD countries)EcuadorEgypt, Arab Rep.El SalvadorEquatorial GuineaEritreaEstoniaEthiopiaEuro areaEurope & Central AsiaEurope & Central Asia (excluding high income)Europe & Central Asia (IDA & IBRD countries)European UnionFaroe IslandsFijiFinlandFragile and conflict affected situationsFranceFrench PolynesiaGabonGambia, TheGeorgiaGermanyGhanaGreeceGreenlandGrenadaGuatemalaGuineaGuinea-BissauGuyanaHaitiHeavily indebted poor countries (HIPC)High incomeHondurasHong Kong SAR, ChinaHungaryIBRD onlyIcelandIDA & IBRD totalIDA blendIDA onlyIDA totalIndiaIndonesiaIran, Islamic Rep.IraqIrelandIsraelItalyJamaicaJapanJordanKazakhstanKenyaKiribatiKorea, Rep.KuwaitKyrgyz RepublicLao PDRLate-demographic dividendLatin America & Caribbean Latin America & Caribbean (excluding high income)Latin America & the Caribbean (IDA & IBRD countries)LatviaLeast developed countries: UN classificationLebanonLesothoLiberiaLibyaLithuaniaLow & middle incomeLow incomeLower middle incomeLuxembourgMacao SAR, ChinaMacedonia, FYRMadagascarMalawiMalaysiaMaldivesMaliMaltaMarshall IslandsMauritaniaMauritiusMexicoMicronesia, Fed. Sts.Middle East & North AfricaMiddle East & North Africa (excluding high income)Middle East & North Africa (IDA & IBRD countries)Middle incomeMoldovaMongoliaMontenegroMoroccoMozambiqueMyanmarNamibiaNepalNetherlandsNew CaledoniaNew ZealandNicaraguaNigerNigeriaNorth AmericaNorwayOECD membersOmanOther small statesPacific island small statesPakistanPalauPanamaPapua New GuineaParaguayPeruPhilippinesPolandPortugalPost-demographic dividendPre-demographic dividendQatarRomaniaRussian FederationRwandaSamoaSao Tome and PrincipeSaudi ArabiaSenegalSerbiaSeychellesSierra LeoneSingaporeSlovak RepublicSloveniaSmall statesSolomon IslandsSouth AfricaSouth AsiaSouth Asia (IDA & IBRD)SpainSri LankaSt. Kitts and NevisSt. LuciaSt. Vincent and the GrenadinesSub-Saharan Africa Sub-Saharan Africa (excluding high income)Sub-Saharan Africa (IDA & IBRD countries)SudanSurinameSwazilandSwedenSwitzerlandSyrian Arab RepublicTajikistanTanzaniaThailandTimor-LesteTogoTongaTrinidad and TobagoTunisiaTurkeyTurkmenistanTuvaluUgandaUkraineUnited Arab EmiratesUnited KingdomUnited StatesUpper middle incomeUruguayUzbekistanVanuatuVenezuela, RBVietnamWorldYemen, Rep.ZambiaZimbabwe Timeline:
This timeline shows a graph from 1972 to 2016 of Argentina. No data until 1971. Number of actual observations by date: 45.
Source name:
World Development Indicators
Source organization:
World Trade Organization, and World Bank GDP estimates.
Categories, topics:
Private Sector, Trade
Last updated:
apr 23, 2017
Indicators value changes by year
Minimum:
10.435
jan 1, 1987
Maximum:
35.447
jan 1, 2003
At the date of observation
Value
Absolute change
Change from previous value
jan 1, 1972
21.677
+21.677
0.0%
jan 1, 1973
13.841
-7.836
-36.15%
jan 1, 1974
11.621
-2.22
-16.04%
jan 1, 1975
11.605
-0.016
-0.14%
jan 1, 1976
14.241
+2.636
22.72%
jan 1, 1977
13.581
-0.661
-4.64%
jan 1, 1978
17.283
+3.702
27.26%
jan 1, 1979
17.618
+0.336
1.94%
jan 1, 1980
20.952
+3.334
18.92%
jan 1, 1981
24.118
+3.166
15.11%
jan 1, 1982
23.607
-0.512
-2.12%
jan 1, 1983
15.375
-8.232
-34.87%
jan 1, 1984
11.868
-3.507
-22.81%
jan 1, 1985
16.047
+4.179
35.22%
jan 1, 1986
13.81
-2.238
-13.94%
jan 1, 1987
10.435
-3.375
-24.44%
jan 1, 1988
10.961
+0.526
5.04%
jan 1, 1989
11.455
+0.494
4.51%
jan 1, 1990
17.984
+6.528
56.99%
jan 1, 1991
11.623
-6.361
-35.37%
jan 1, 1992
10.675
-0.948
-8.15%
jan 1, 1993
11.848
+1.173
10.99%
jan 1, 1994
12.631
+0.783
6.61%
jan 1, 1995
14.445
+1.814
14.36%
jan 1, 1996
15.924
+1.479
10.24%
jan 1, 1997
17.48
+1.556
9.77%
jan 1, 1998
19.402
+1.921
10.99%
jan 1, 1999
19.35
-0.052
-0.27%
jan 1, 2000
17.226
-2.123
-10.97%
jan 1, 2001
18.119
+0.893
5.18%
jan 1, 2002
17.441
-0.678
-3.74%
jan 1, 2003
35.447
+18.006
103.24%
jan 1, 2004
34.016
-1.431
-4.04%
jan 1, 2005
34.63
+0.614
1.8%
jan 1, 2006
34.607
-0.023
-0.07%
jan 1, 2007
34.548
-0.059
-0.17%
jan 1, 2008
34.79
+0.242
0.7%
jan 1, 2009
35.105
+0.315
0.91%
jan 1, 2010
28.239
-6.866
-19.56%
jan 1, 2011
29.344
+1.104
3.91%
jan 1, 2012
29.702
+0.358
1.22%
jan 1, 2013
26.953
-2.748
-9.25%
jan 1, 2014
27.141
+0.188
0.7%
jan 1, 2015
25.214
-1.927
-7.1%
jan 1, 2016
19.984
-5.23
-20.74%
Ranking of countries by current statistics by years


Comments: