29
/
en
AIzaSyAYiBZKx7MnpbEhh9jyipgxe19OcubqV5w
April 1, 2024
167790
Kenya
KEN
true
2
1
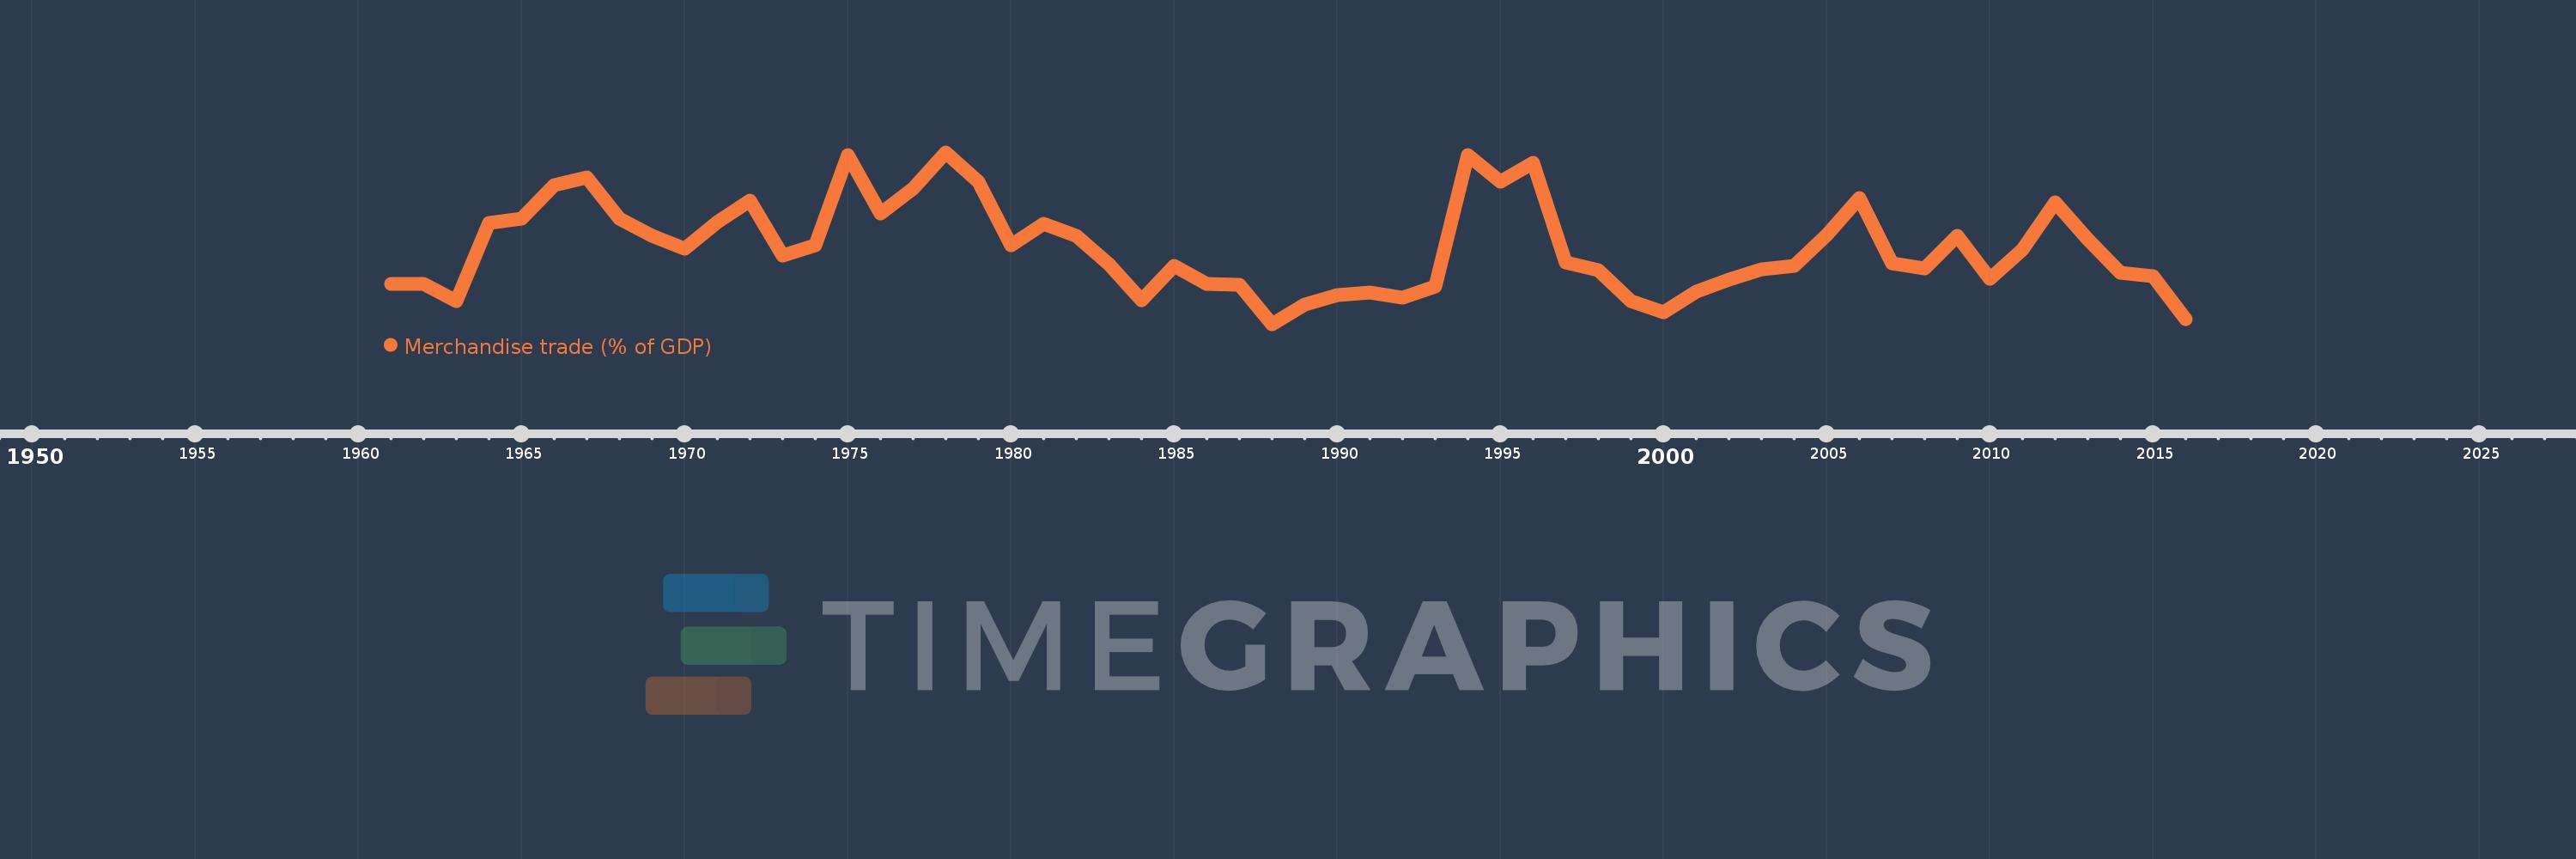
Merchandise trade (% of GDP)
2016,2015,2014,2013,2012,2011,2010,2009,2008,2007,2006,2005,2004,2003,2002,2001,2000,1999,1998,1997,1996,1995,1994,1993,1992,1991,1990,1989,1988,1987,1986,1985,1984,1983,1982,1981,1980,1979,1978,1977,1976,1975,1974,1973,1972,1971,1970,1969,1968,1967,1966,1965,1964,1963,1962,1961
This statistics in other country:
AfghanistanAlbaniaAlgeriaAngolaAntigua and BarbudaArab WorldArgentinaArmeniaArubaAustraliaAustriaAzerbaijanBahamas, TheBahrainBangladeshBarbadosBelarusBelgiumBelizeBeninBermudaBhutanBoliviaBosnia and HerzegovinaBotswanaBrazilBrunei DarussalamBulgariaBurkina FasoBurundiCabo VerdeCambodiaCameroonCanadaCaribbean small statesCentral African RepublicCentral Europe and the BalticsChadChileChinaColombiaComorosCongo, Dem. Rep.Congo, Rep.Costa RicaCote d'IvoireCroatiaCubaCyprusCzech RepublicDenmarkDjiboutiDominicaDominican RepublicEarly-demographic dividendEast Asia & PacificEast Asia & Pacific (excluding high income)East Asia & Pacific (IDA & IBRD countries)EcuadorEgypt, Arab Rep.El SalvadorEquatorial GuineaEritreaEstoniaEthiopiaEuro areaEurope & Central AsiaEurope & Central Asia (excluding high income)Europe & Central Asia (IDA & IBRD countries)European UnionFaroe IslandsFijiFinlandFragile and conflict affected situationsFranceFrench PolynesiaGabonGambia, TheGeorgiaGermanyGhanaGreeceGreenlandGrenadaGuatemalaGuineaGuinea-BissauGuyanaHaitiHeavily indebted poor countries (HIPC)High incomeHondurasHong Kong SAR, ChinaHungaryIBRD onlyIcelandIDA & IBRD totalIDA blendIDA onlyIDA totalIndiaIndonesiaIran, Islamic Rep.IraqIrelandIsraelItalyJamaicaJapanJordanKazakhstanKenyaKiribatiKorea, Rep.KuwaitKyrgyz RepublicLao PDRLate-demographic dividendLatin America & Caribbean Latin America & Caribbean (excluding high income)Latin America & the Caribbean (IDA & IBRD countries)LatviaLeast developed countries: UN classificationLebanonLesothoLiberiaLibyaLithuaniaLow & middle incomeLow incomeLower middle incomeLuxembourgMacao SAR, ChinaMacedonia, FYRMadagascarMalawiMalaysiaMaldivesMaliMaltaMarshall IslandsMauritaniaMauritiusMexicoMicronesia, Fed. Sts.Middle East & North AfricaMiddle East & North Africa (excluding high income)Middle East & North Africa (IDA & IBRD countries)Middle incomeMoldovaMongoliaMontenegroMoroccoMozambiqueMyanmarNamibiaNepalNetherlandsNew CaledoniaNew ZealandNicaraguaNigerNigeriaNorth AmericaNorwayOECD membersOmanOther small statesPacific island small statesPakistanPalauPanamaPapua New GuineaParaguayPeruPhilippinesPolandPortugalPost-demographic dividendPre-demographic dividendQatarRomaniaRussian FederationRwandaSamoaSao Tome and PrincipeSaudi ArabiaSenegalSerbiaSeychellesSierra LeoneSingaporeSlovak RepublicSloveniaSmall statesSolomon IslandsSouth AfricaSouth AsiaSouth Asia (IDA & IBRD)SpainSri LankaSt. Kitts and NevisSt. LuciaSt. Vincent and the GrenadinesSub-Saharan Africa Sub-Saharan Africa (excluding high income)Sub-Saharan Africa (IDA & IBRD countries)SudanSurinameSwazilandSwedenSwitzerlandSyrian Arab RepublicTajikistanTanzaniaThailandTimor-LesteTogoTongaTrinidad and TobagoTunisiaTurkeyTurkmenistanTuvaluUgandaUkraineUnited Arab EmiratesUnited KingdomUnited StatesUpper middle incomeUruguayUzbekistanVanuatuVenezuela, RBVietnamWorldYemen, Rep.ZambiaZimbabwe Timeline:
This timeline shows a graph from 1961 to 2016 of Kenya. No data until 1960. Number of actual observations by date: 56.
Source name:
World Development Indicators
Source organization:
World Trade Organization, and World Bank GDP estimates.
Categories, topics:
Private Sector, Trade
Last updated:
apr 23, 2017
Indicators value changes by year
Minimum:
34.074
jan 1, 1988
Maximum:
55.079
jan 1, 1978
At the date of observation
Value
Absolute change
Change from previous value
jan 1, 1961
38.976
+38.976
0.0%
jan 1, 1962
39.044
+0.068
0.17%
jan 1, 1963
36.931
-2.113
-5.41%
jan 1, 1964
46.415
+9.485
25.68%
jan 1, 1965
46.93
+0.515
1.11%
jan 1, 1966
51.122
+4.192
8.93%
jan 1, 1967
52.008
+0.885
1.73%
jan 1, 1968
46.979
-5.029
-9.67%
jan 1, 1969
44.91
-2.068
-4.4%
jan 1, 1970
43.333
-1.577
-3.51%
jan 1, 1971
46.607
+3.274
7.56%
jan 1, 1972
49.147
+2.54
5.45%
jan 1, 1973
42.446
-6.7
-13.63%
jan 1, 1974
43.768
+1.322
3.11%
jan 1, 1975
54.77
+11.002
25.14%
jan 1, 1976
47.595
-7.175
-13.1%
jan 1, 1977
50.625
+3.031
6.37%
jan 1, 1978
55.079
+4.454
8.8%
jan 1, 1979
51.532
-3.547
-6.44%
jan 1, 1980
43.734
-7.799
-15.13%
jan 1, 1981
46.385
+2.651
6.06%
jan 1, 1982
44.89
-1.494
-3.22%
jan 1, 1983
41.436
-3.454
-7.69%
jan 1, 1984
36.961
-4.475
-10.8%
jan 1, 1985
41.186
+4.224
11.43%
jan 1, 1986
39.022
-2.164
-5.25%
jan 1, 1987
38.858
-0.164
-0.42%
jan 1, 1988
34.074
-4.784
-12.31%
jan 1, 1989
36.456
+2.381
6.99%
jan 1, 1990
37.643
+1.187
3.26%
jan 1, 1991
37.959
+0.316
0.84%
jan 1, 1992
37.331
-0.629
-1.66%
jan 1, 1993
38.737
+1.407
3.77%
jan 1, 1994
54.731
+15.993
41.29%
jan 1, 1995
51.454
-3.277
-5.99%
jan 1, 1996
53.823
+2.369
4.6%
jan 1, 1997
41.641
-12.182
-22.63%
jan 1, 1998
40.653
-0.988
-2.37%
jan 1, 1999
36.931
-3.723
-9.16%
jan 1, 2000
35.507
-1.424
-3.85%
jan 1, 2001
38.086
+2.579
7.26%
jan 1, 2002
39.55
+1.464
3.84%
jan 1, 2003
40.776
+1.225
3.1%
jan 1, 2004
41.172
+0.396
0.97%
jan 1, 2005
44.962
+3.789
9.2%
jan 1, 2006
49.451
+4.489
9.98%
jan 1, 2007
41.566
-7.885
-15.95%
jan 1, 2008
40.897
-0.668
-1.61%
jan 1, 2009
44.933
+4.036
9.87%
jan 1, 2010
39.613
-5.32
-11.84%
jan 1, 2011
43.155
+3.542
8.94%
jan 1, 2012
48.954
+5.799
13.44%
jan 1, 2013
44.469
-4.485
-9.16%
jan 1, 2014
40.315
-4.154
-9.34%
jan 1, 2015
39.924
-0.391
-0.97%
jan 1, 2016
34.7
-5.223
-13.08%
Ranking of countries by current statistics by years


Comments: