29
/
en
AIzaSyAYiBZKx7MnpbEhh9jyipgxe19OcubqV5w
April 1, 2024
191662
Malta
MLT
true
2
1
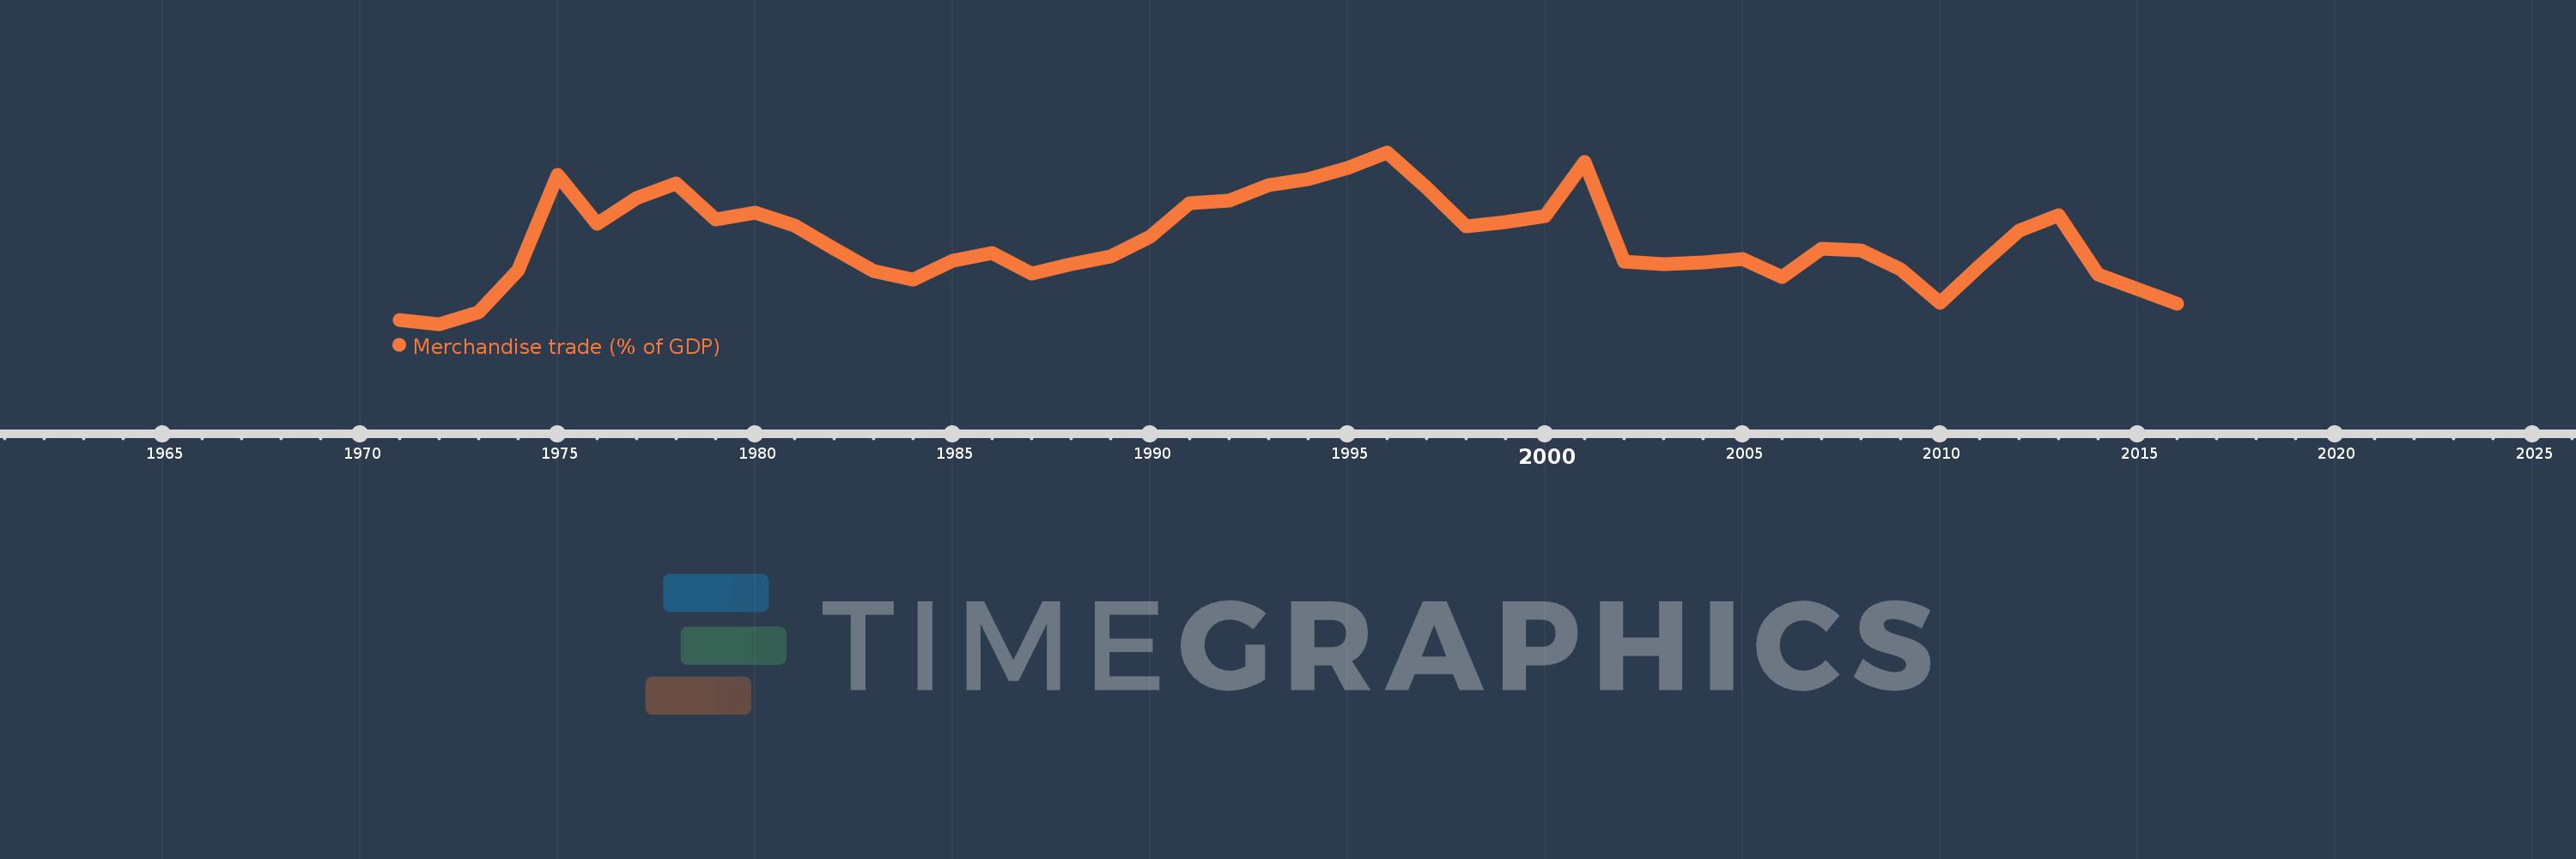
Merchandise trade (% of GDP)
2016,2015,2014,2013,2012,2011,2010,2009,2008,2007,2006,2005,2004,2003,2002,2001,2000,1999,1998,1997,1996,1995,1994,1993,1992,1991,1990,1989,1988,1987,1986,1985,1984,1983,1982,1981,1980,1979,1978,1977,1976,1975,1974,1973,1972,1971
This statistics in other country:
AfghanistanAlbaniaAlgeriaAngolaAntigua and BarbudaArab WorldArgentinaArmeniaArubaAustraliaAustriaAzerbaijanBahamas, TheBahrainBangladeshBarbadosBelarusBelgiumBelizeBeninBermudaBhutanBoliviaBosnia and HerzegovinaBotswanaBrazilBrunei DarussalamBulgariaBurkina FasoBurundiCabo VerdeCambodiaCameroonCanadaCaribbean small statesCentral African RepublicCentral Europe and the BalticsChadChileChinaColombiaComorosCongo, Dem. Rep.Congo, Rep.Costa RicaCote d'IvoireCroatiaCubaCyprusCzech RepublicDenmarkDjiboutiDominicaDominican RepublicEarly-demographic dividendEast Asia & PacificEast Asia & Pacific (excluding high income)East Asia & Pacific (IDA & IBRD countries)EcuadorEgypt, Arab Rep.El SalvadorEquatorial GuineaEritreaEstoniaEthiopiaEuro areaEurope & Central AsiaEurope & Central Asia (excluding high income)Europe & Central Asia (IDA & IBRD countries)European UnionFaroe IslandsFijiFinlandFragile and conflict affected situationsFranceFrench PolynesiaGabonGambia, TheGeorgiaGermanyGhanaGreeceGreenlandGrenadaGuatemalaGuineaGuinea-BissauGuyanaHaitiHeavily indebted poor countries (HIPC)High incomeHondurasHong Kong SAR, ChinaHungaryIBRD onlyIcelandIDA & IBRD totalIDA blendIDA onlyIDA totalIndiaIndonesiaIran, Islamic Rep.IraqIrelandIsraelItalyJamaicaJapanJordanKazakhstanKenyaKiribatiKorea, Rep.KuwaitKyrgyz RepublicLao PDRLate-demographic dividendLatin America & Caribbean Latin America & Caribbean (excluding high income)Latin America & the Caribbean (IDA & IBRD countries)LatviaLeast developed countries: UN classificationLebanonLesothoLiberiaLibyaLithuaniaLow & middle incomeLow incomeLower middle incomeLuxembourgMacao SAR, ChinaMacedonia, FYRMadagascarMalawiMalaysiaMaldivesMaliMaltaMarshall IslandsMauritaniaMauritiusMexicoMicronesia, Fed. Sts.Middle East & North AfricaMiddle East & North Africa (excluding high income)Middle East & North Africa (IDA & IBRD countries)Middle incomeMoldovaMongoliaMontenegroMoroccoMozambiqueMyanmarNamibiaNepalNetherlandsNew CaledoniaNew ZealandNicaraguaNigerNigeriaNorth AmericaNorwayOECD membersOmanOther small statesPacific island small statesPakistanPalauPanamaPapua New GuineaParaguayPeruPhilippinesPolandPortugalPost-demographic dividendPre-demographic dividendQatarRomaniaRussian FederationRwandaSamoaSao Tome and PrincipeSaudi ArabiaSenegalSerbiaSeychellesSierra LeoneSingaporeSlovak RepublicSloveniaSmall statesSolomon IslandsSouth AfricaSouth AsiaSouth Asia (IDA & IBRD)SpainSri LankaSt. Kitts and NevisSt. LuciaSt. Vincent and the GrenadinesSub-Saharan Africa Sub-Saharan Africa (excluding high income)Sub-Saharan Africa (IDA & IBRD countries)SudanSurinameSwazilandSwedenSwitzerlandSyrian Arab RepublicTajikistanTanzaniaThailandTimor-LesteTogoTongaTrinidad and TobagoTunisiaTurkeyTurkmenistanTuvaluUgandaUkraineUnited Arab EmiratesUnited KingdomUnited StatesUpper middle incomeUruguayUzbekistanVanuatuVenezuela, RBVietnamWorldYemen, Rep.ZambiaZimbabwe Timeline:
This timeline shows a graph from 1971 to 2016 of Malta. No data until 1970. Number of actual observations by date: 46.
Source name:
World Development Indicators
Source organization:
World Trade Organization, and World Bank GDP estimates.
Categories, topics:
Private Sector, Trade
Last updated:
apr 23, 2017
Indicators value changes by year
Maximum:
139.668
jan 1, 1996
At the date of observation
Value
Absolute change
Change from previous value
jan 1, 1971
79.628
+79.628
0.0%
jan 1, 1972
78.22
-1.409
-1.77%
jan 1, 1973
82.51
+4.291
5.49%
jan 1, 1974
97.534
+15.023
18.21%
jan 1, 1975
131.664
+34.13
34.99%
jan 1, 1976
113.996
-17.668
-13.42%
jan 1, 1977
123.375
+9.379
8.23%
jan 1, 1978
128.555
+5.18
4.2%
jan 1, 1979
115.623
-12.933
-10.06%
jan 1, 1980
118.227
+2.604
2.25%
jan 1, 1981
113.658
-4.569
-3.86%
jan 1, 1982
105.27
-8.388
-7.38%
jan 1, 1983
97.204
-8.066
-7.66%
jan 1, 1984
94.015
-3.189
-3.28%
jan 1, 1985
100.832
+6.817
7.25%
jan 1, 1986
103.683
+2.85
2.83%
jan 1, 1987
96.441
-7.242
-6.98%
jan 1, 1988
99.586
+3.145
3.26%
jan 1, 1989
102.353
+2.767
2.78%
jan 1, 1990
109.649
+7.296
7.13%
jan 1, 1991
121.586
+11.937
10.89%
jan 1, 1992
122.325
+0.739
0.61%
jan 1, 1993
128.098
+5.772
4.72%
jan 1, 1994
130.261
+2.163
1.69%
jan 1, 1995
133.964
+3.703
2.84%
jan 1, 1996
139.668
+5.704
4.26%
jan 1, 1997
126.937
-12.731
-9.12%
jan 1, 1998
113.16
-13.777
-10.85%
jan 1, 1999
114.74
+1.58
1.4%
jan 1, 2000
116.8
+2.06
1.8%
jan 1, 2001
136.233
+19.433
16.64%
jan 1, 2002
100.485
-35.748
-26.24%
jan 1, 2003
99.662
-0.824
-0.82%
jan 1, 2004
100.424
+0.763
0.77%
jan 1, 2005
101.564
+1.14
1.14%
jan 1, 2006
95.07
-6.494
-6.39%
jan 1, 2007
105.113
+10.043
10.56%
jan 1, 2008
104.542
-0.57
-0.54%
jan 1, 2009
97.822
-6.721
-6.43%
jan 1, 2010
86.01
-11.812
-12.07%
jan 1, 2011
98.935
+12.925
15.03%
jan 1, 2012
111.737
+12.801
12.94%
jan 1, 2013
117.123
+5.386
4.82%
jan 1, 2014
96.02
-21.103
-18.02%
jan 1, 2015
90.785
-5.235
-5.45%
jan 1, 2016
85.648
-5.137
-5.66%
Ranking of countries by current statistics by years


Comments: