29
/
en
AIzaSyAYiBZKx7MnpbEhh9jyipgxe19OcubqV5w
April 1, 2024
35168
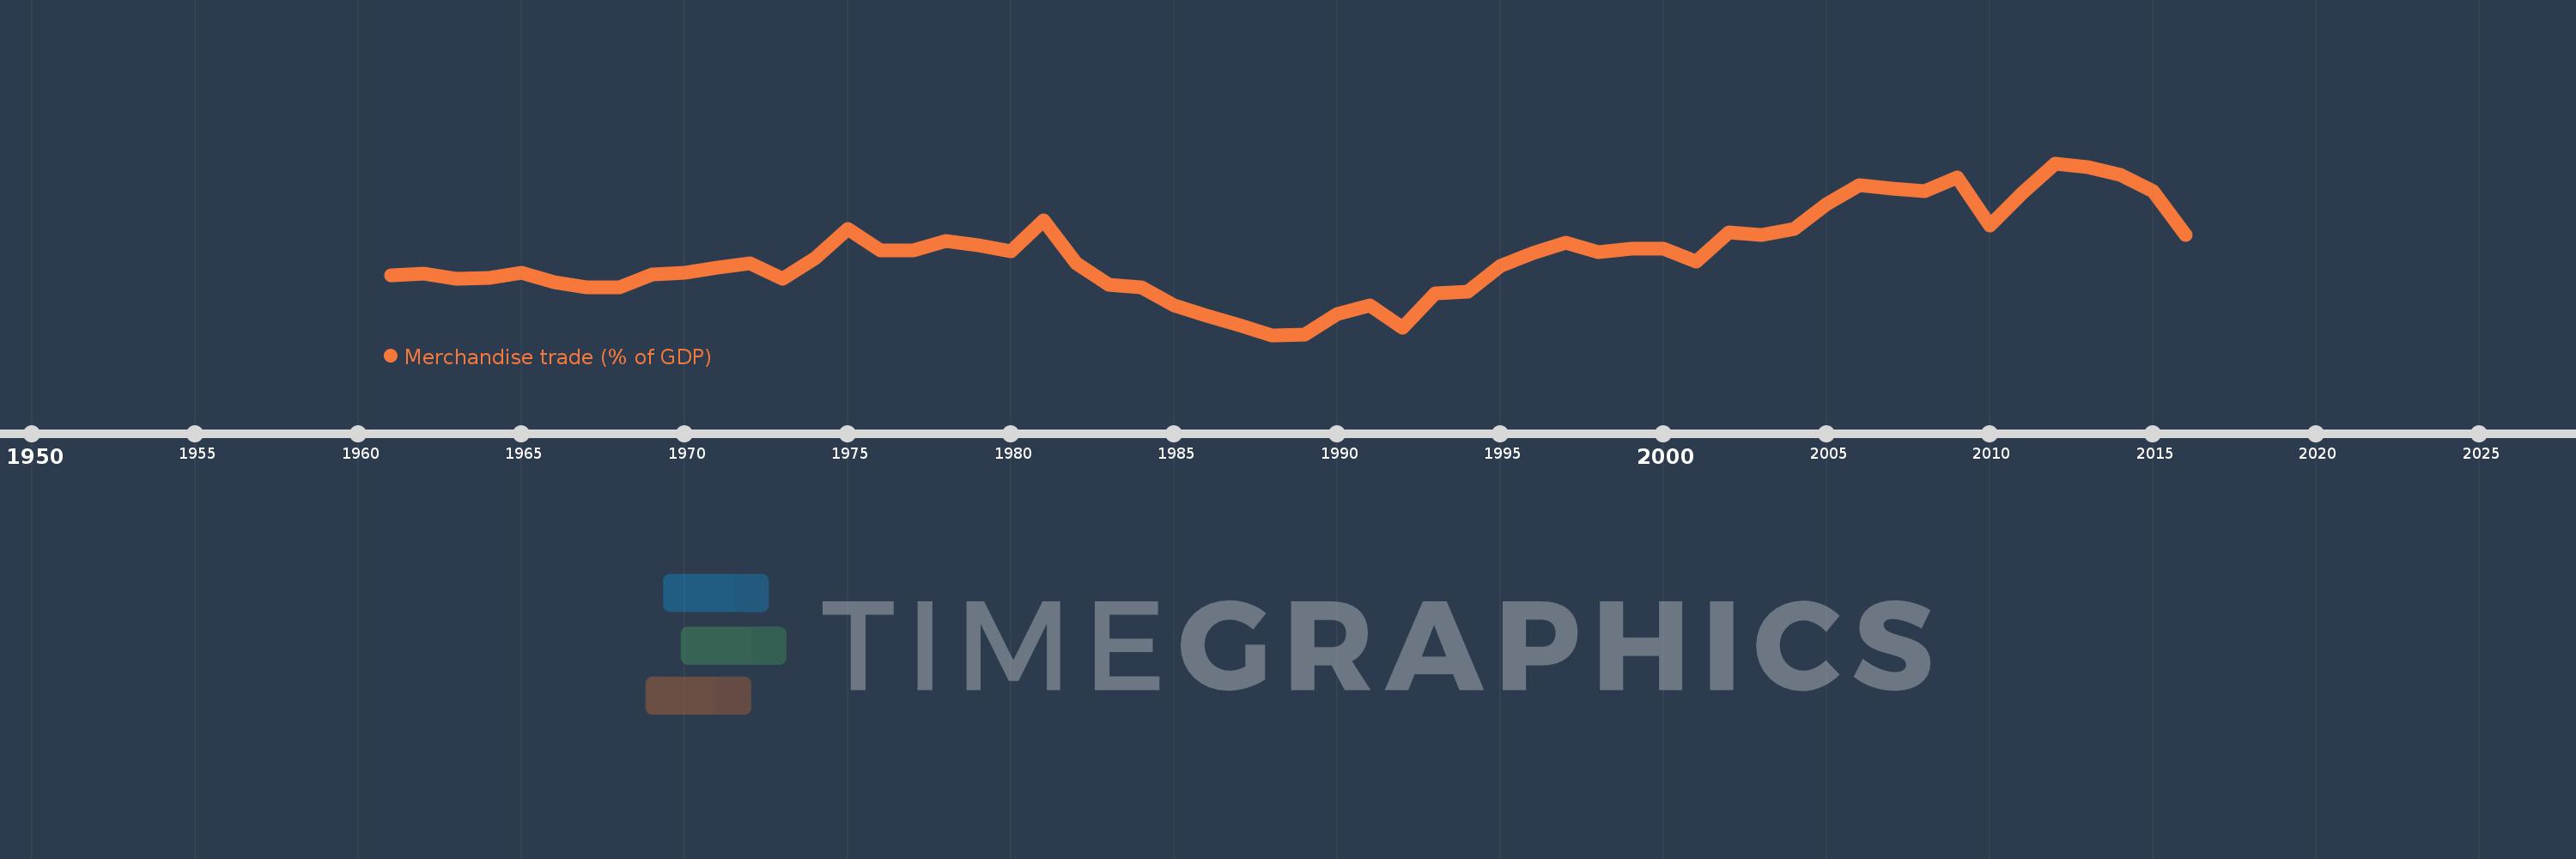
Heavily indebted poor countries (HIPC)
HPC
false
2
1
Merchandise trade (% of GDP)
2016,2015,2014,2013,2012,2011,2010,2009,2008,2007,2006,2005,2004,2003,2002,2001,2000,1999,1998,1997,1996,1995,1994,1993,1992,1991,1990,1989,1988,1987,1986,1985,1984,1983,1982,1981,1980,1979,1978,1977,1976,1975,1974,1973,1972,1971,1970,1969,1968,1967,1966,1965,1964,1963,1962,1961
This statistics in other country:
AfghanistanAlbaniaAlgeriaAngolaAntigua and BarbudaArab WorldArgentinaArmeniaArubaAustraliaAustriaAzerbaijanBahamas, TheBahrainBangladeshBarbadosBelarusBelgiumBelizeBeninBermudaBhutanBoliviaBosnia and HerzegovinaBotswanaBrazilBrunei DarussalamBulgariaBurkina FasoBurundiCabo VerdeCambodiaCameroonCanadaCaribbean small statesCentral African RepublicCentral Europe and the BalticsChadChileChinaColombiaComorosCongo, Dem. Rep.Congo, Rep.Costa RicaCote d'IvoireCroatiaCubaCyprusCzech RepublicDenmarkDjiboutiDominicaDominican RepublicEarly-demographic dividendEast Asia & PacificEast Asia & Pacific (excluding high income)East Asia & Pacific (IDA & IBRD countries)EcuadorEgypt, Arab Rep.El SalvadorEquatorial GuineaEritreaEstoniaEthiopiaEuro areaEurope & Central AsiaEurope & Central Asia (excluding high income)Europe & Central Asia (IDA & IBRD countries)European UnionFaroe IslandsFijiFinlandFragile and conflict affected situationsFranceFrench PolynesiaGabonGambia, TheGeorgiaGermanyGhanaGreeceGreenlandGrenadaGuatemalaGuineaGuinea-BissauGuyanaHaitiHeavily indebted poor countries (HIPC)High incomeHondurasHong Kong SAR, ChinaHungaryIBRD onlyIcelandIDA & IBRD totalIDA blendIDA onlyIDA totalIndiaIndonesiaIran, Islamic Rep.IraqIrelandIsraelItalyJamaicaJapanJordanKazakhstanKenyaKiribatiKorea, Rep.KuwaitKyrgyz RepublicLao PDRLate-demographic dividendLatin America & Caribbean Latin America & Caribbean (excluding high income)Latin America & the Caribbean (IDA & IBRD countries)LatviaLeast developed countries: UN classificationLebanonLesothoLiberiaLibyaLithuaniaLow & middle incomeLow incomeLower middle incomeLuxembourgMacao SAR, ChinaMacedonia, FYRMadagascarMalawiMalaysiaMaldivesMaliMaltaMarshall IslandsMauritaniaMauritiusMexicoMicronesia, Fed. Sts.Middle East & North AfricaMiddle East & North Africa (excluding high income)Middle East & North Africa (IDA & IBRD countries)Middle incomeMoldovaMongoliaMontenegroMoroccoMozambiqueMyanmarNamibiaNepalNetherlandsNew CaledoniaNew ZealandNicaraguaNigerNigeriaNorth AmericaNorwayOECD membersOmanOther small statesPacific island small statesPakistanPalauPanamaPapua New GuineaParaguayPeruPhilippinesPolandPortugalPost-demographic dividendPre-demographic dividendQatarRomaniaRussian FederationRwandaSamoaSao Tome and PrincipeSaudi ArabiaSenegalSerbiaSeychellesSierra LeoneSingaporeSlovak RepublicSloveniaSmall statesSolomon IslandsSouth AfricaSouth AsiaSouth Asia (IDA & IBRD)SpainSri LankaSt. Kitts and NevisSt. LuciaSt. Vincent and the GrenadinesSub-Saharan Africa Sub-Saharan Africa (excluding high income)Sub-Saharan Africa (IDA & IBRD countries)SudanSurinameSwazilandSwedenSwitzerlandSyrian Arab RepublicTajikistanTanzaniaThailandTimor-LesteTogoTongaTrinidad and TobagoTunisiaTurkeyTurkmenistanTuvaluUgandaUkraineUnited Arab EmiratesUnited KingdomUnited StatesUpper middle incomeUruguayUzbekistanVanuatuVenezuela, RBVietnamWorldYemen, Rep.ZambiaZimbabwe Timeline:
This timeline shows a graph from 1961 to 2016 of Heavily indebted poor countries (HIPC). No data until 1960. Number of actual observations by date: 56.
Source name:
World Development Indicators
Source organization:
World Trade Organization, and World Bank GDP estimates.
Categories, topics:
Private Sector, Trade
Last updated:
apr 23, 2017
Indicators value changes by year
Minimum:
29.024
jan 1, 1988
Maximum:
56.711
jan 1, 2012
At the date of observation
Value
Absolute change
Change from previous value
jan 1, 1961
38.695
+38.695
0.0%
jan 1, 1962
38.926
+0.231
0.6%
jan 1, 1963
38.044
-0.882
-2.27%
jan 1, 1964
38.161
+0.117
0.31%
jan 1, 1965
39.103
+0.943
2.47%
jan 1, 1966
37.526
-1.577
-4.03%
jan 1, 1967
36.695
-0.83
-2.21%
jan 1, 1968
36.721
+0.025
0.07%
jan 1, 1969
38.795
+2.074
5.65%
jan 1, 1970
39.015
+0.22
0.57%
jan 1, 1971
39.928
+0.912
2.34%
jan 1, 1972
40.522
+0.594
1.49%
jan 1, 1973
38.097
-2.425
-5.98%
jan 1, 1974
41.353
+3.257
8.55%
jan 1, 1975
46.11
+4.756
11.5%
jan 1, 1976
42.608
-3.502
-7.59%
jan 1, 1977
42.718
+0.11
0.26%
jan 1, 1978
44.198
+1.48
3.46%
jan 1, 1979
43.426
-0.772
-1.75%
jan 1, 1980
42.479
-0.948
-2.18%
jan 1, 1981
47.51
+5.031
11.84%
jan 1, 1982
40.518
-6.992
-14.72%
jan 1, 1983
37.065
-3.453
-8.52%
jan 1, 1984
36.688
-0.377
-1.02%
jan 1, 1985
33.856
-2.832
-7.72%
jan 1, 1986
32.094
-1.761
-5.2%
jan 1, 1987
30.548
-1.546
-4.82%
jan 1, 1988
29.024
-1.524
-4.99%
jan 1, 1989
29.138
+0.113
0.39%
jan 1, 1990
32.384
+3.246
11.14%
jan 1, 1991
33.807
+1.424
4.4%
jan 1, 1992
30.229
-3.578
-10.58%
jan 1, 1993
35.682
+5.453
18.04%
jan 1, 1994
36.021
+0.339
0.95%
jan 1, 1995
40.149
+4.128
11.46%
jan 1, 1996
42.31
+2.161
5.38%
jan 1, 1997
43.908
+1.598
3.78%
jan 1, 1998
42.314
-1.594
-3.63%
jan 1, 1999
42.995
+0.681
1.61%
jan 1, 2000
42.945
-0.05
-0.12%
jan 1, 2001
40.829
-2.116
-4.93%
jan 1, 2002
45.525
+4.696
11.5%
jan 1, 2003
45.149
-0.376
-0.83%
jan 1, 2004
46.143
+0.994
2.2%
jan 1, 2005
50.195
+4.052
8.78%
jan 1, 2006
53.189
+2.994
5.96%
jan 1, 2007
52.677
-0.512
-0.96%
jan 1, 2008
52.245
-0.432
-0.82%
jan 1, 2009
54.488
+2.243
4.29%
jan 1, 2010
46.682
-7.807
-14.33%
jan 1, 2011
51.93
+5.249
11.24%
jan 1, 2012
56.711
+4.78
9.21%
jan 1, 2013
56.12
-0.591
-1.04%
jan 1, 2014
54.821
-1.298
-2.31%
jan 1, 2015
52.171
-2.651
-4.84%
jan 1, 2016
45.098
-7.073
-13.56%
Ranking of countries by current statistics by years


Comments: