29
/
en
AIzaSyAYiBZKx7MnpbEhh9jyipgxe19OcubqV5w
April 1, 2024
60015
Sub-Saharan Africa (excluding high income)
SSA
false
2
1
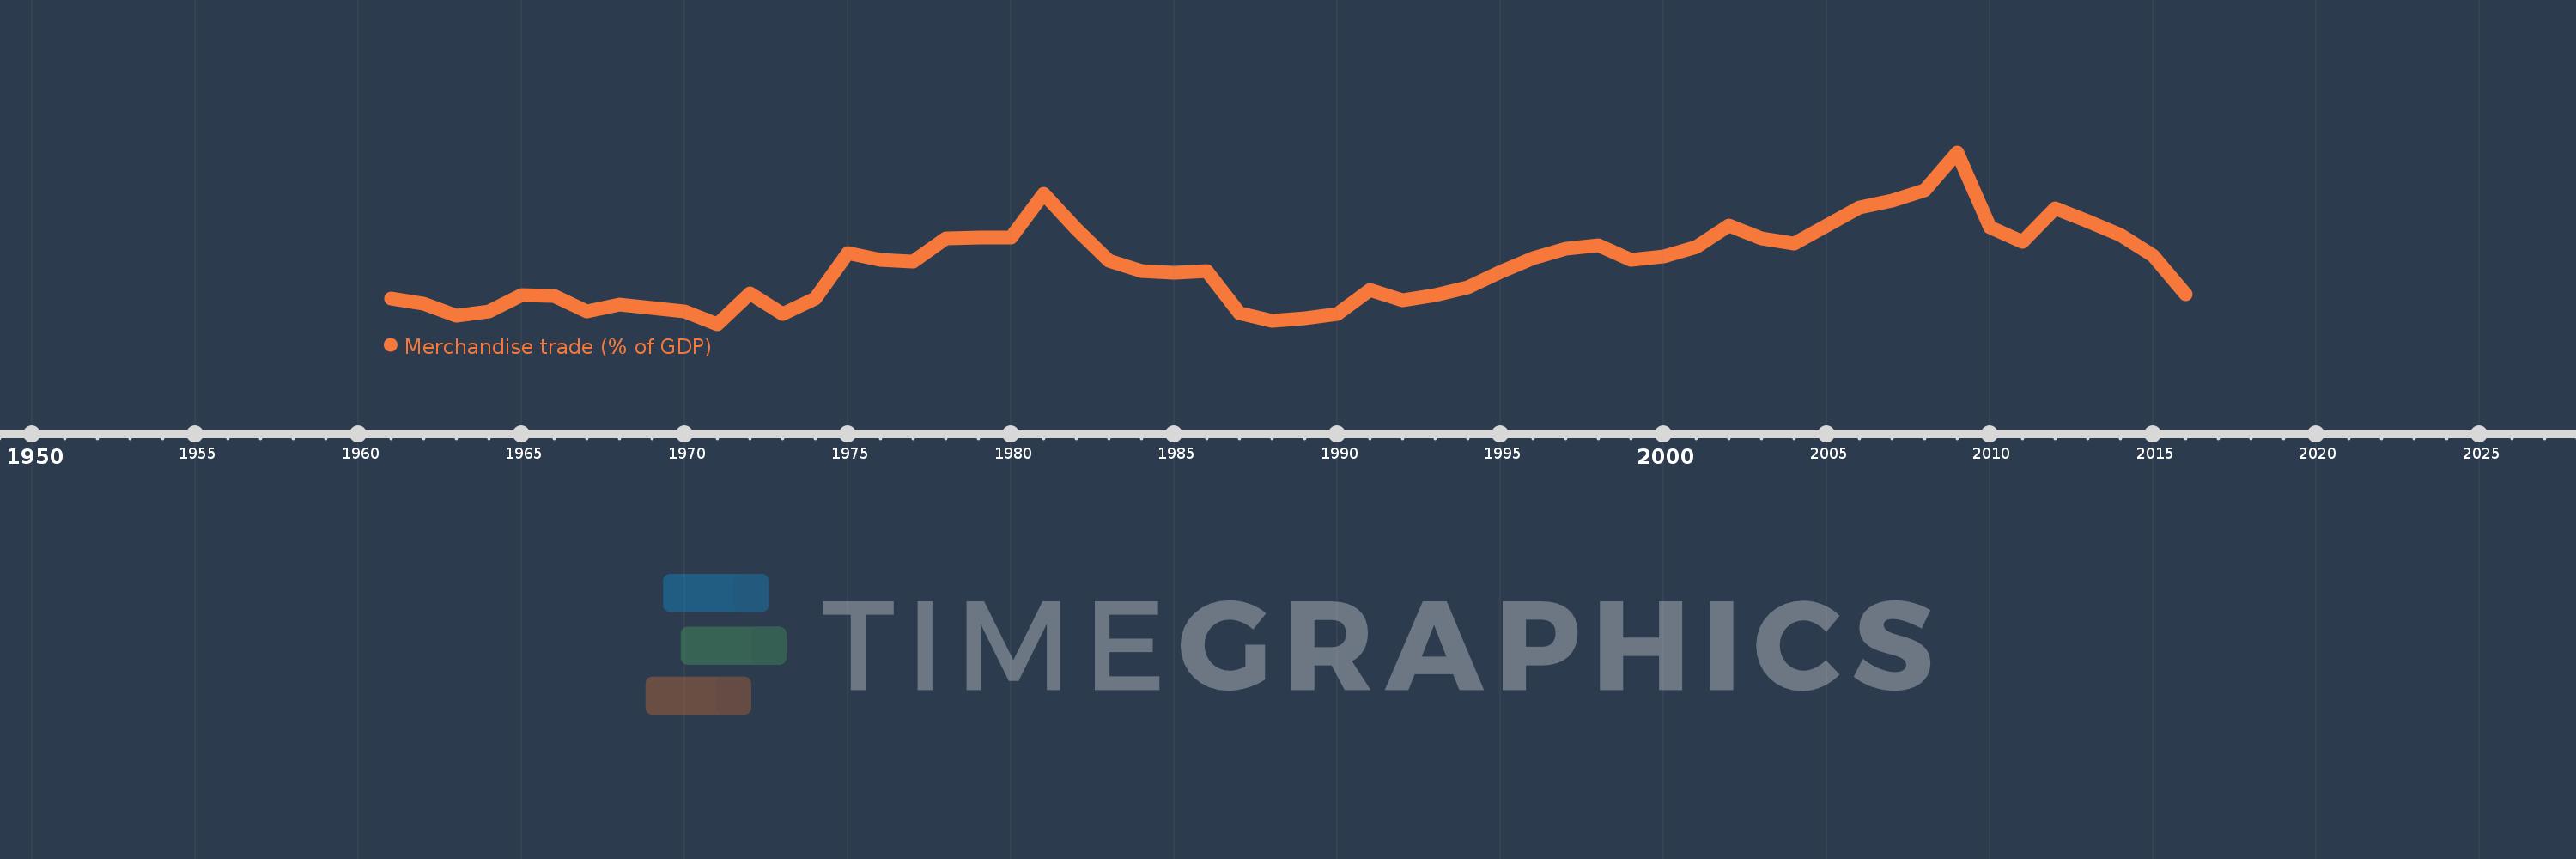
Merchandise trade (% of GDP)
2016,2015,2014,2013,2012,2011,2010,2009,2008,2007,2006,2005,2004,2003,2002,2001,2000,1999,1998,1997,1996,1995,1994,1993,1992,1991,1990,1989,1988,1987,1986,1985,1984,1983,1982,1981,1980,1979,1978,1977,1976,1975,1974,1973,1972,1971,1970,1969,1968,1967,1966,1965,1964,1963,1962,1961
This statistics in other country:
AfghanistanAlbaniaAlgeriaAngolaAntigua and BarbudaArab WorldArgentinaArmeniaArubaAustraliaAustriaAzerbaijanBahamas, TheBahrainBangladeshBarbadosBelarusBelgiumBelizeBeninBermudaBhutanBoliviaBosnia and HerzegovinaBotswanaBrazilBrunei DarussalamBulgariaBurkina FasoBurundiCabo VerdeCambodiaCameroonCanadaCaribbean small statesCentral African RepublicCentral Europe and the BalticsChadChileChinaColombiaComorosCongo, Dem. Rep.Congo, Rep.Costa RicaCote d'IvoireCroatiaCubaCyprusCzech RepublicDenmarkDjiboutiDominicaDominican RepublicEarly-demographic dividendEast Asia & PacificEast Asia & Pacific (excluding high income)East Asia & Pacific (IDA & IBRD countries)EcuadorEgypt, Arab Rep.El SalvadorEquatorial GuineaEritreaEstoniaEthiopiaEuro areaEurope & Central AsiaEurope & Central Asia (excluding high income)Europe & Central Asia (IDA & IBRD countries)European UnionFaroe IslandsFijiFinlandFragile and conflict affected situationsFranceFrench PolynesiaGabonGambia, TheGeorgiaGermanyGhanaGreeceGreenlandGrenadaGuatemalaGuineaGuinea-BissauGuyanaHaitiHeavily indebted poor countries (HIPC)High incomeHondurasHong Kong SAR, ChinaHungaryIBRD onlyIcelandIDA & IBRD totalIDA blendIDA onlyIDA totalIndiaIndonesiaIran, Islamic Rep.IraqIrelandIsraelItalyJamaicaJapanJordanKazakhstanKenyaKiribatiKorea, Rep.KuwaitKyrgyz RepublicLao PDRLate-demographic dividendLatin America & Caribbean Latin America & Caribbean (excluding high income)Latin America & the Caribbean (IDA & IBRD countries)LatviaLeast developed countries: UN classificationLebanonLesothoLiberiaLibyaLithuaniaLow & middle incomeLow incomeLower middle incomeLuxembourgMacao SAR, ChinaMacedonia, FYRMadagascarMalawiMalaysiaMaldivesMaliMaltaMarshall IslandsMauritaniaMauritiusMexicoMicronesia, Fed. Sts.Middle East & North AfricaMiddle East & North Africa (excluding high income)Middle East & North Africa (IDA & IBRD countries)Middle incomeMoldovaMongoliaMontenegroMoroccoMozambiqueMyanmarNamibiaNepalNetherlandsNew CaledoniaNew ZealandNicaraguaNigerNigeriaNorth AmericaNorwayOECD membersOmanOther small statesPacific island small statesPakistanPalauPanamaPapua New GuineaParaguayPeruPhilippinesPolandPortugalPost-demographic dividendPre-demographic dividendQatarRomaniaRussian FederationRwandaSamoaSao Tome and PrincipeSaudi ArabiaSenegalSerbiaSeychellesSierra LeoneSingaporeSlovak RepublicSloveniaSmall statesSolomon IslandsSouth AfricaSouth AsiaSouth Asia (IDA & IBRD)SpainSri LankaSt. Kitts and NevisSt. LuciaSt. Vincent and the GrenadinesSub-Saharan Africa Sub-Saharan Africa (excluding high income)Sub-Saharan Africa (IDA & IBRD countries)SudanSurinameSwazilandSwedenSwitzerlandSyrian Arab RepublicTajikistanTanzaniaThailandTimor-LesteTogoTongaTrinidad and TobagoTunisiaTurkeyTurkmenistanTuvaluUgandaUkraineUnited Arab EmiratesUnited KingdomUnited StatesUpper middle incomeUruguayUzbekistanVanuatuVenezuela, RBVietnamWorldYemen, Rep.ZambiaZimbabwe Timeline:
This timeline shows a graph from 1961 to 2016 of Sub-Saharan Africa (excluding high income). No data until 1960. Number of actual observations by date: 56.
Source name:
World Development Indicators
Source organization:
World Trade Organization, and World Bank GDP estimates.
Categories, topics:
Private Sector, Trade
Last updated:
apr 23, 2017
Indicators value changes by year
Minimum:
35.888
jan 1, 1971
Maximum:
63.873
jan 1, 2009
At the date of observation
Value
Absolute change
Change from previous value
jan 1, 1961
40.023
+40.023
0.0%
jan 1, 1962
39.17
-0.853
-2.13%
jan 1, 1963
37.221
-1.949
-4.98%
jan 1, 1964
37.994
+0.773
2.08%
jan 1, 1965
40.636
+2.642
6.95%
jan 1, 1966
40.527
-0.109
-0.27%
jan 1, 1967
38.026
-2.501
-6.17%
jan 1, 1968
39.111
+1.086
2.86%
jan 1, 1969
38.486
-0.626
-1.6%
jan 1, 1970
38.004
-0.482
-1.25%
jan 1, 1971
35.888
-2.116
-5.57%
jan 1, 1972
40.85
+4.961
13.82%
jan 1, 1973
37.569
-3.28
-8.03%
jan 1, 1974
40.027
+2.458
6.54%
jan 1, 1975
47.455
+7.428
18.56%
jan 1, 1976
46.384
-1.071
-2.26%
jan 1, 1977
46.131
-0.252
-0.54%
jan 1, 1978
49.849
+3.717
8.06%
jan 1, 1979
49.998
+0.15
0.3%
jan 1, 1980
50.038
+0.04
0.08%
jan 1, 1981
57.184
+7.146
14.28%
jan 1, 1982
51.416
-5.768
-10.09%
jan 1, 1983
46.196
-5.22
-10.15%
jan 1, 1984
44.486
-1.71
-3.7%
jan 1, 1985
44.23
-0.256
-0.58%
jan 1, 1986
44.545
+0.315
0.71%
jan 1, 1987
37.642
-6.903
-15.5%
jan 1, 1988
36.465
-1.178
-3.13%
jan 1, 1989
36.874
+0.409
1.12%
jan 1, 1990
37.551
+0.677
1.84%
jan 1, 1991
41.466
+3.915
10.43%
jan 1, 1992
39.83
-1.636
-3.95%
jan 1, 1993
40.655
+0.825
2.07%
jan 1, 1994
41.883
+1.228
3.02%
jan 1, 1995
44.445
+2.562
6.12%
jan 1, 1996
46.611
+2.166
4.87%
jan 1, 1997
48.173
+1.562
3.35%
jan 1, 1998
48.805
+0.632
1.31%
jan 1, 1999
46.369
-2.436
-4.99%
jan 1, 2000
46.915
+0.545
1.18%
jan 1, 2001
48.504
+1.589
3.39%
jan 1, 2002
51.99
+3.486
7.19%
jan 1, 2003
49.836
-2.154
-4.14%
jan 1, 2004
49.095
-0.741
-1.49%
jan 1, 2005
52.006
+2.911
5.93%
jan 1, 2006
54.944
+2.939
5.65%
jan 1, 2007
55.994
+1.05
1.91%
jan 1, 2008
57.705
+1.711
3.06%
jan 1, 2009
63.873
+6.168
10.69%
jan 1, 2010
51.664
-12.209
-19.11%
jan 1, 2011
49.326
-2.338
-4.53%
jan 1, 2012
54.83
+5.504
11.16%
jan 1, 2013
52.705
-2.125
-3.88%
jan 1, 2014
50.402
-2.303
-4.37%
jan 1, 2015
47.019
-3.383
-6.71%
jan 1, 2016
40.764
-6.255
-13.3%
Ranking of countries by current statistics by years


Comments: