29
/
en
AIzaSyAYiBZKx7MnpbEhh9jyipgxe19OcubqV5w
April 1, 2024
185479
Madagascar
MDG
true
2
1
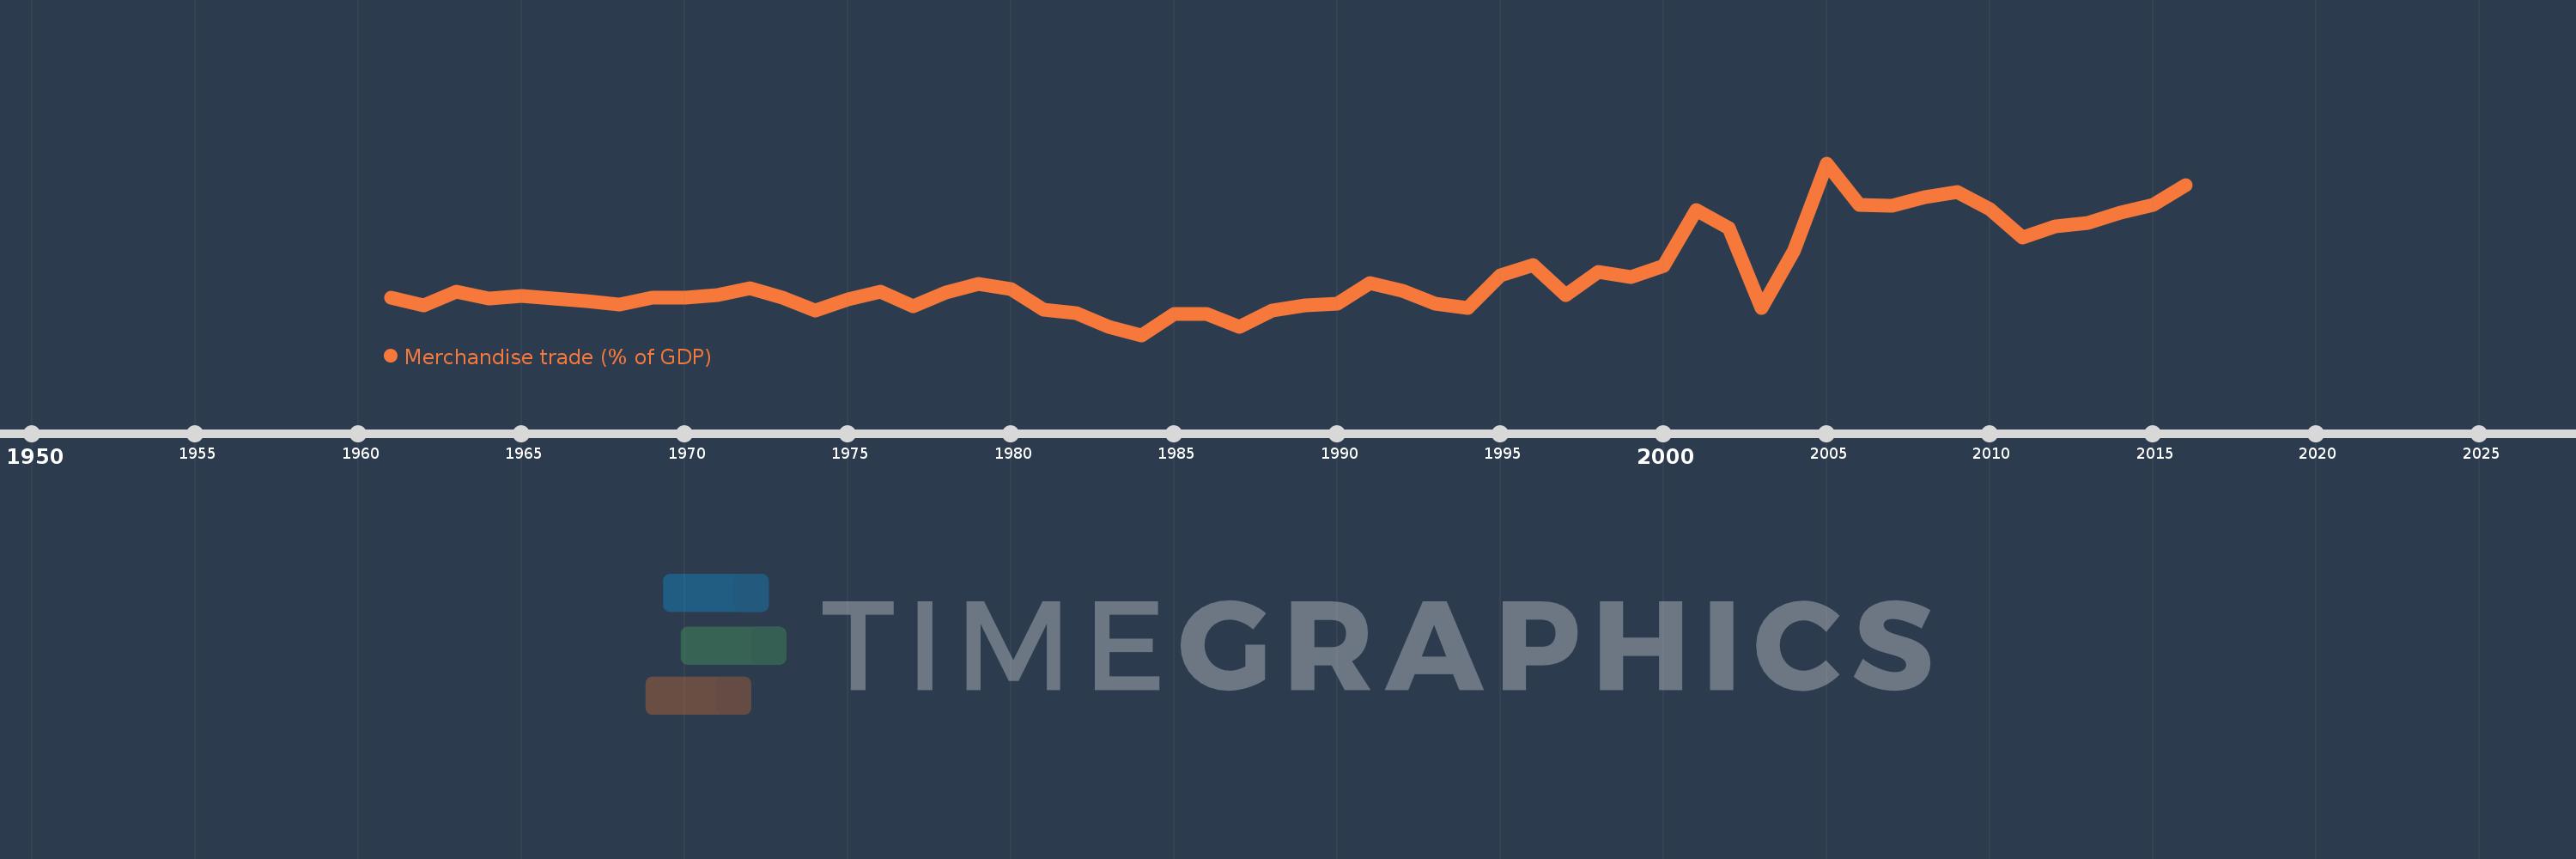
Merchandise trade (% of GDP)
2016,2015,2014,2013,2012,2011,2010,2009,2008,2007,2006,2005,2004,2003,2002,2001,2000,1999,1998,1997,1996,1995,1994,1993,1992,1991,1990,1989,1988,1987,1986,1985,1984,1983,1982,1981,1980,1979,1978,1977,1976,1975,1974,1973,1972,1971,1970,1969,1968,1967,1966,1965,1964,1963,1962,1961
This statistics in other country:
AfghanistanAlbaniaAlgeriaAngolaAntigua and BarbudaArab WorldArgentinaArmeniaArubaAustraliaAustriaAzerbaijanBahamas, TheBahrainBangladeshBarbadosBelarusBelgiumBelizeBeninBermudaBhutanBoliviaBosnia and HerzegovinaBotswanaBrazilBrunei DarussalamBulgariaBurkina FasoBurundiCabo VerdeCambodiaCameroonCanadaCaribbean small statesCentral African RepublicCentral Europe and the BalticsChadChileChinaColombiaComorosCongo, Dem. Rep.Congo, Rep.Costa RicaCote d'IvoireCroatiaCubaCyprusCzech RepublicDenmarkDjiboutiDominicaDominican RepublicEarly-demographic dividendEast Asia & PacificEast Asia & Pacific (excluding high income)East Asia & Pacific (IDA & IBRD countries)EcuadorEgypt, Arab Rep.El SalvadorEquatorial GuineaEritreaEstoniaEthiopiaEuro areaEurope & Central AsiaEurope & Central Asia (excluding high income)Europe & Central Asia (IDA & IBRD countries)European UnionFaroe IslandsFijiFinlandFragile and conflict affected situationsFranceFrench PolynesiaGabonGambia, TheGeorgiaGermanyGhanaGreeceGreenlandGrenadaGuatemalaGuineaGuinea-BissauGuyanaHaitiHeavily indebted poor countries (HIPC)High incomeHondurasHong Kong SAR, ChinaHungaryIBRD onlyIcelandIDA & IBRD totalIDA blendIDA onlyIDA totalIndiaIndonesiaIran, Islamic Rep.IraqIrelandIsraelItalyJamaicaJapanJordanKazakhstanKenyaKiribatiKorea, Rep.KuwaitKyrgyz RepublicLao PDRLate-demographic dividendLatin America & Caribbean Latin America & Caribbean (excluding high income)Latin America & the Caribbean (IDA & IBRD countries)LatviaLeast developed countries: UN classificationLebanonLesothoLiberiaLibyaLithuaniaLow & middle incomeLow incomeLower middle incomeLuxembourgMacao SAR, ChinaMacedonia, FYRMadagascarMalawiMalaysiaMaldivesMaliMaltaMarshall IslandsMauritaniaMauritiusMexicoMicronesia, Fed. Sts.Middle East & North AfricaMiddle East & North Africa (excluding high income)Middle East & North Africa (IDA & IBRD countries)Middle incomeMoldovaMongoliaMontenegroMoroccoMozambiqueMyanmarNamibiaNepalNetherlandsNew CaledoniaNew ZealandNicaraguaNigerNigeriaNorth AmericaNorwayOECD membersOmanOther small statesPacific island small statesPakistanPalauPanamaPapua New GuineaParaguayPeruPhilippinesPolandPortugalPost-demographic dividendPre-demographic dividendQatarRomaniaRussian FederationRwandaSamoaSao Tome and PrincipeSaudi ArabiaSenegalSerbiaSeychellesSierra LeoneSingaporeSlovak RepublicSloveniaSmall statesSolomon IslandsSouth AfricaSouth AsiaSouth Asia (IDA & IBRD)SpainSri LankaSt. Kitts and NevisSt. LuciaSt. Vincent and the GrenadinesSub-Saharan Africa Sub-Saharan Africa (excluding high income)Sub-Saharan Africa (IDA & IBRD countries)SudanSurinameSwazilandSwedenSwitzerlandSyrian Arab RepublicTajikistanTanzaniaThailandTimor-LesteTogoTongaTrinidad and TobagoTunisiaTurkeyTurkmenistanTuvaluUgandaUkraineUnited Arab EmiratesUnited KingdomUnited StatesUpper middle incomeUruguayUzbekistanVanuatuVenezuela, RBVietnamWorldYemen, Rep.ZambiaZimbabwe Timeline:
This timeline shows a graph from 1961 to 2016 of Madagascar. No data until 1960. Number of actual observations by date: 56.
Source name:
World Development Indicators
Source organization:
World Trade Organization, and World Bank GDP estimates.
Categories, topics:
Private Sector, Trade
Last updated:
apr 23, 2017
Indicators value changes by year
At the date of observation
Value
Absolute change
Change from previous value
jan 1, 1961
27.7
+27.7
0.0%
jan 1, 1962
25.882
-1.818
-6.56%
jan 1, 1963
29.214
+3.332
12.88%
jan 1, 1964
27.604
-1.61
-5.51%
jan 1, 1965
28.323
+0.719
2.61%
jan 1, 1966
27.598
-0.725
-2.56%
jan 1, 1967
27.046
-0.552
-2.0%
jan 1, 1968
26.089
-0.957
-3.54%
jan 1, 1969
27.735
+1.646
6.31%
jan 1, 1970
27.81
+0.076
0.27%
jan 1, 1971
28.36
+0.55
1.98%
jan 1, 1972
30.151
+1.791
6.31%
jan 1, 1973
27.704
-2.447
-8.12%
jan 1, 1974
24.556
-3.148
-11.36%
jan 1, 1975
27.391
+2.835
11.55%
jan 1, 1976
29.209
+1.818
6.64%
jan 1, 1977
25.68
-3.529
-12.08%
jan 1, 1978
29.073
+3.393
13.21%
jan 1, 1979
31.126
+2.054
7.06%
jan 1, 1980
29.887
-1.239
-3.98%
jan 1, 1981
24.764
-5.123
-17.14%
jan 1, 1982
23.951
-0.813
-3.28%
jan 1, 1983
20.56
-3.39
-14.16%
jan 1, 1984
18.51
-2.05
-9.97%
jan 1, 1985
23.814
+5.303
28.65%
jan 1, 1986
23.654
-0.16
-0.67%
jan 1, 1987
20.502
-3.152
-13.33%
jan 1, 1988
24.672
+4.171
20.34%
jan 1, 1989
25.957
+1.285
5.21%
jan 1, 1990
26.34
+0.384
1.48%
jan 1, 1991
31.478
+5.138
19.51%
jan 1, 1992
29.437
-2.042
-6.49%
jan 1, 1993
26.385
-3.052
-10.37%
jan 1, 1994
25.187
-1.198
-4.54%
jan 1, 1995
33.456
+8.269
32.83%
jan 1, 1996
35.919
+2.463
7.36%
jan 1, 1997
28.485
-7.433
-20.7%
jan 1, 1998
34.125
+5.64
19.8%
jan 1, 1999
32.926
-1.199
-3.51%
jan 1, 2000
35.669
+2.743
8.33%
jan 1, 2001
49.543
+13.874
38.9%
jan 1, 2002
45.167
-4.376
-8.83%
jan 1, 2003
25.304
-19.862
-43.98%
jan 1, 2004
39.467
+14.162
55.97%
jan 1, 2005
61.22
+21.754
55.12%
jan 1, 2006
50.82
-10.4
-16.99%
jan 1, 2007
50.561
-0.259
-0.51%
jan 1, 2008
52.743
+2.181
4.31%
jan 1, 2009
54.079
+1.336
2.53%
jan 1, 2010
49.715
-4.364
-8.07%
jan 1, 2011
42.764
-6.951
-13.98%
jan 1, 2012
45.442
+2.678
6.26%
jan 1, 2013
46.474
+1.032
2.27%
jan 1, 2014
48.88
+2.407
5.18%
jan 1, 2015
50.813
+1.933
3.95%
jan 1, 2016
55.762
+4.949
9.74%
Ranking of countries by current statistics by years


Comments: