29
/
en
AIzaSyAYiBZKx7MnpbEhh9jyipgxe19OcubqV5w
April 1, 2024
52062
North America
NAC
false
2
1
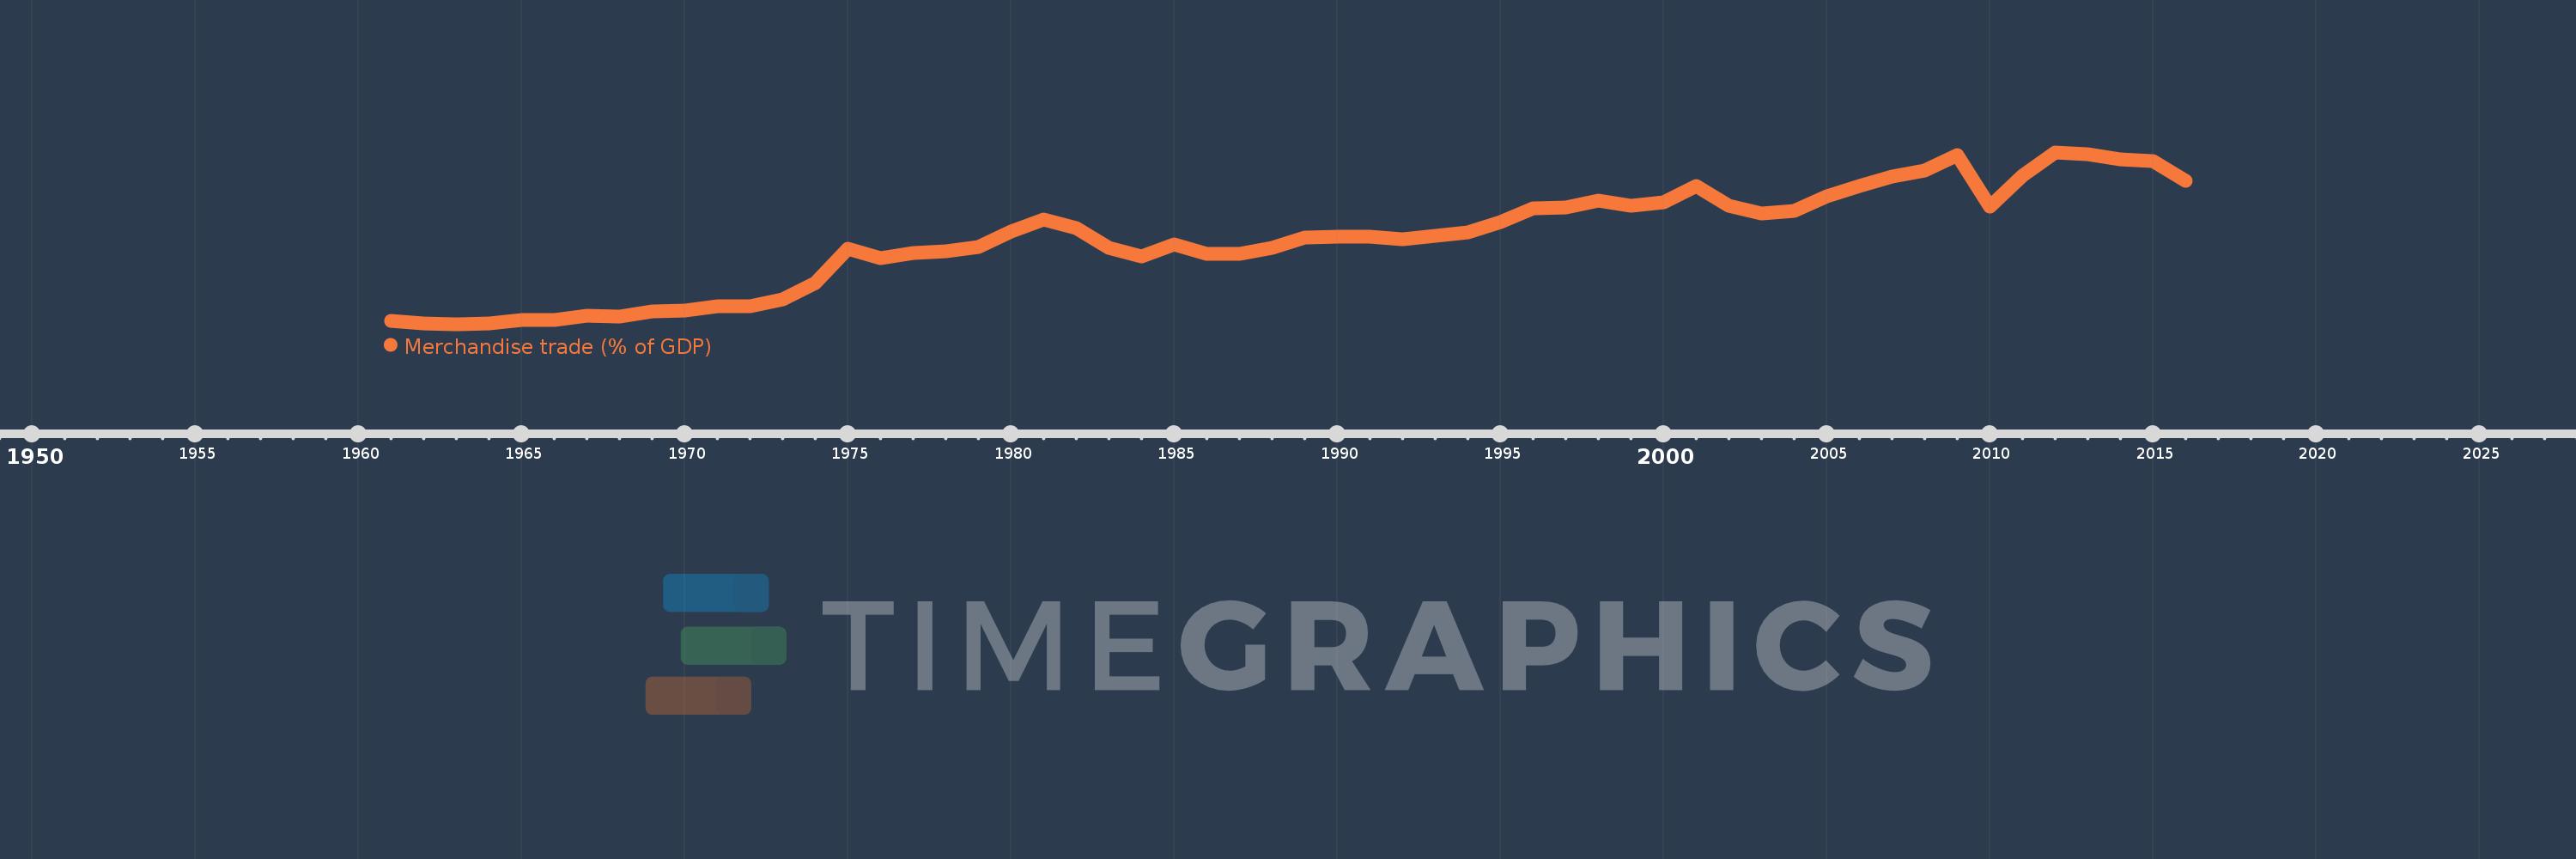
Merchandise trade (% of GDP)
2016,2015,2014,2013,2012,2011,2010,2009,2008,2007,2006,2005,2004,2003,2002,2001,2000,1999,1998,1997,1996,1995,1994,1993,1992,1991,1990,1989,1988,1987,1986,1985,1984,1983,1982,1981,1980,1979,1978,1977,1976,1975,1974,1973,1972,1971,1970,1969,1968,1967,1966,1965,1964,1963,1962,1961
This statistics in other country:
AfghanistanAlbaniaAlgeriaAngolaAntigua and BarbudaArab WorldArgentinaArmeniaArubaAustraliaAustriaAzerbaijanBahamas, TheBahrainBangladeshBarbadosBelarusBelgiumBelizeBeninBermudaBhutanBoliviaBosnia and HerzegovinaBotswanaBrazilBrunei DarussalamBulgariaBurkina FasoBurundiCabo VerdeCambodiaCameroonCanadaCaribbean small statesCentral African RepublicCentral Europe and the BalticsChadChileChinaColombiaComorosCongo, Dem. Rep.Congo, Rep.Costa RicaCote d'IvoireCroatiaCubaCyprusCzech RepublicDenmarkDjiboutiDominicaDominican RepublicEarly-demographic dividendEast Asia & PacificEast Asia & Pacific (excluding high income)East Asia & Pacific (IDA & IBRD countries)EcuadorEgypt, Arab Rep.El SalvadorEquatorial GuineaEritreaEstoniaEthiopiaEuro areaEurope & Central AsiaEurope & Central Asia (excluding high income)Europe & Central Asia (IDA & IBRD countries)European UnionFaroe IslandsFijiFinlandFragile and conflict affected situationsFranceFrench PolynesiaGabonGambia, TheGeorgiaGermanyGhanaGreeceGreenlandGrenadaGuatemalaGuineaGuinea-BissauGuyanaHaitiHeavily indebted poor countries (HIPC)High incomeHondurasHong Kong SAR, ChinaHungaryIBRD onlyIcelandIDA & IBRD totalIDA blendIDA onlyIDA totalIndiaIndonesiaIran, Islamic Rep.IraqIrelandIsraelItalyJamaicaJapanJordanKazakhstanKenyaKiribatiKorea, Rep.KuwaitKyrgyz RepublicLao PDRLate-demographic dividendLatin America & Caribbean Latin America & Caribbean (excluding high income)Latin America & the Caribbean (IDA & IBRD countries)LatviaLeast developed countries: UN classificationLebanonLesothoLiberiaLibyaLithuaniaLow & middle incomeLow incomeLower middle incomeLuxembourgMacao SAR, ChinaMacedonia, FYRMadagascarMalawiMalaysiaMaldivesMaliMaltaMarshall IslandsMauritaniaMauritiusMexicoMicronesia, Fed. Sts.Middle East & North AfricaMiddle East & North Africa (excluding high income)Middle East & North Africa (IDA & IBRD countries)Middle incomeMoldovaMongoliaMontenegroMoroccoMozambiqueMyanmarNamibiaNepalNetherlandsNew CaledoniaNew ZealandNicaraguaNigerNigeriaNorth AmericaNorwayOECD membersOmanOther small statesPacific island small statesPakistanPalauPanamaPapua New GuineaParaguayPeruPhilippinesPolandPortugalPost-demographic dividendPre-demographic dividendQatarRomaniaRussian FederationRwandaSamoaSao Tome and PrincipeSaudi ArabiaSenegalSerbiaSeychellesSierra LeoneSingaporeSlovak RepublicSloveniaSmall statesSolomon IslandsSouth AfricaSouth AsiaSouth Asia (IDA & IBRD)SpainSri LankaSt. Kitts and NevisSt. LuciaSt. Vincent and the GrenadinesSub-Saharan Africa Sub-Saharan Africa (excluding high income)Sub-Saharan Africa (IDA & IBRD countries)SudanSurinameSwazilandSwedenSwitzerlandSyrian Arab RepublicTajikistanTanzaniaThailandTimor-LesteTogoTongaTrinidad and TobagoTunisiaTurkeyTurkmenistanTuvaluUgandaUkraineUnited Arab EmiratesUnited KingdomUnited StatesUpper middle incomeUruguayUzbekistanVanuatuVenezuela, RBVietnamWorldYemen, Rep.ZambiaZimbabwe Timeline:
This timeline shows a graph from 1961 to 2016 of North America. No data until 1960. Number of actual observations by date: 56.
Source name:
World Development Indicators
Source organization:
World Trade Organization, and World Bank GDP estimates.
Categories, topics:
Private Sector, Trade
Last updated:
apr 23, 2017
Indicators value changes by year
Maximum:
26.943
jan 1, 2012
At the date of observation
Value
Absolute change
Change from previous value
jan 1, 1961
8.363
+8.363
0.0%
jan 1, 1962
8.134
-0.229
-2.74%
jan 1, 1963
8.028
-0.106
-1.3%
jan 1, 1964
8.086
+0.058
0.72%
jan 1, 1965
8.497
+0.41
5.08%
jan 1, 1966
8.508
+0.011
0.13%
jan 1, 1967
8.944
+0.436
5.13%
jan 1, 1968
8.881
-0.063
-0.71%
jan 1, 1969
9.431
+0.55
6.19%
jan 1, 1970
9.556
+0.125
1.32%
jan 1, 1971
10.028
+0.472
4.94%
jan 1, 1972
10.05
+0.023
0.23%
jan 1, 1973
10.739
+0.689
6.85%
jan 1, 1974
12.549
+1.81
16.86%
jan 1, 1975
16.327
+3.778
30.1%
jan 1, 1976
15.295
-1.032
-6.32%
jan 1, 1977
15.84
+0.545
3.56%
jan 1, 1978
16.07
+0.23
1.45%
jan 1, 1979
16.566
+0.496
3.08%
jan 1, 1980
18.208
+1.643
9.92%
jan 1, 1981
19.547
+1.339
7.35%
jan 1, 1982
18.623
-0.923
-4.72%
jan 1, 1983
16.426
-2.198
-11.8%
jan 1, 1984
15.516
-0.91
-5.54%
jan 1, 1985
16.803
+1.288
8.3%
jan 1, 1986
15.773
-1.031
-6.13%
jan 1, 1987
15.814
+0.042
0.26%
jan 1, 1988
16.402
+0.588
3.72%
jan 1, 1989
17.57
+1.168
7.12%
jan 1, 1990
17.656
+0.085
0.49%
jan 1, 1991
17.674
+0.019
0.1%
jan 1, 1992
17.427
-0.247
-1.4%
jan 1, 1993
17.754
+0.327
1.87%
jan 1, 1994
18.142
+0.389
2.19%
jan 1, 1995
19.304
+1.162
6.41%
jan 1, 1996
20.759
+1.455
7.54%
jan 1, 1997
20.896
+0.137
0.66%
jan 1, 1998
21.633
+0.737
3.53%
jan 1, 1999
21.057
-0.577
-2.67%
jan 1, 2000
21.418
+0.362
1.72%
jan 1, 2001
23.239
+1.821
8.5%
jan 1, 2002
21.09
-2.15
-9.25%
jan 1, 2003
20.223
-0.867
-4.11%
jan 1, 2004
20.524
+0.301
1.49%
jan 1, 2005
22.088
+1.564
7.62%
jan 1, 2006
23.253
+1.165
5.27%
jan 1, 2007
24.329
+1.076
4.63%
jan 1, 2008
24.96
+0.631
2.59%
jan 1, 2009
26.629
+1.67
6.69%
jan 1, 2010
20.945
-5.684
-21.35%
jan 1, 2011
24.355
+3.409
16.28%
jan 1, 2012
26.943
+2.588
10.63%
jan 1, 2013
26.772
-0.171
-0.63%
jan 1, 2014
26.134
-0.639
-2.39%
jan 1, 2015
26.009
-0.124
-0.48%
jan 1, 2016
23.779
-2.23
-8.57%
Ranking of countries by current statistics by years


Comments: