29
/
en
AIzaSyAYiBZKx7MnpbEhh9jyipgxe19OcubqV5w
April 1, 2024
56413
Small states
SST
false
2
1
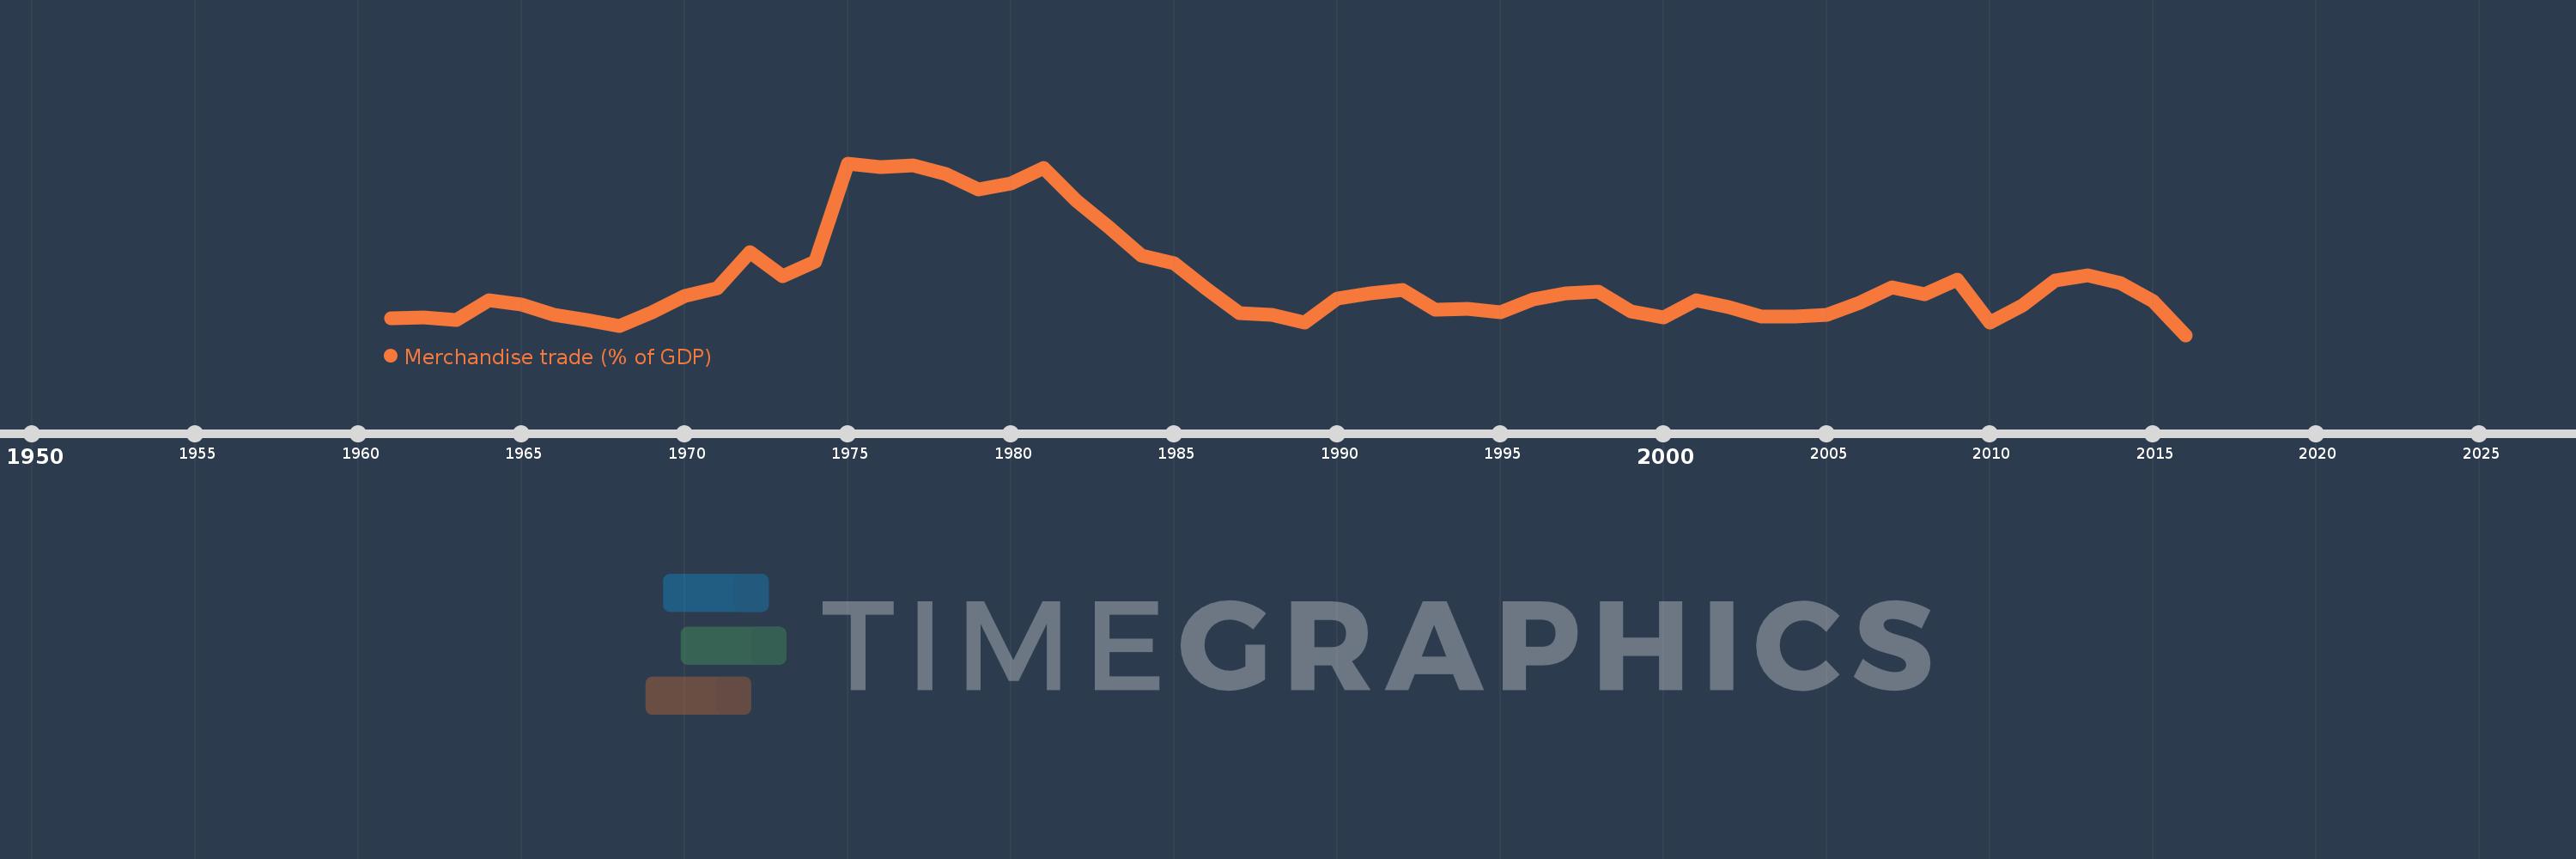
Merchandise trade (% of GDP)
2016,2015,2014,2013,2012,2011,2010,2009,2008,2007,2006,2005,2004,2003,2002,2001,2000,1999,1998,1997,1996,1995,1994,1993,1992,1991,1990,1989,1988,1987,1986,1985,1984,1983,1982,1981,1980,1979,1978,1977,1976,1975,1974,1973,1972,1971,1970,1969,1968,1967,1966,1965,1964,1963,1962,1961
This statistics in other country:
AfghanistanAlbaniaAlgeriaAngolaAntigua and BarbudaArab WorldArgentinaArmeniaArubaAustraliaAustriaAzerbaijanBahamas, TheBahrainBangladeshBarbadosBelarusBelgiumBelizeBeninBermudaBhutanBoliviaBosnia and HerzegovinaBotswanaBrazilBrunei DarussalamBulgariaBurkina FasoBurundiCabo VerdeCambodiaCameroonCanadaCaribbean small statesCentral African RepublicCentral Europe and the BalticsChadChileChinaColombiaComorosCongo, Dem. Rep.Congo, Rep.Costa RicaCote d'IvoireCroatiaCubaCyprusCzech RepublicDenmarkDjiboutiDominicaDominican RepublicEarly-demographic dividendEast Asia & PacificEast Asia & Pacific (excluding high income)East Asia & Pacific (IDA & IBRD countries)EcuadorEgypt, Arab Rep.El SalvadorEquatorial GuineaEritreaEstoniaEthiopiaEuro areaEurope & Central AsiaEurope & Central Asia (excluding high income)Europe & Central Asia (IDA & IBRD countries)European UnionFaroe IslandsFijiFinlandFragile and conflict affected situationsFranceFrench PolynesiaGabonGambia, TheGeorgiaGermanyGhanaGreeceGreenlandGrenadaGuatemalaGuineaGuinea-BissauGuyanaHaitiHeavily indebted poor countries (HIPC)High incomeHondurasHong Kong SAR, ChinaHungaryIBRD onlyIcelandIDA & IBRD totalIDA blendIDA onlyIDA totalIndiaIndonesiaIran, Islamic Rep.IraqIrelandIsraelItalyJamaicaJapanJordanKazakhstanKenyaKiribatiKorea, Rep.KuwaitKyrgyz RepublicLao PDRLate-demographic dividendLatin America & Caribbean Latin America & Caribbean (excluding high income)Latin America & the Caribbean (IDA & IBRD countries)LatviaLeast developed countries: UN classificationLebanonLesothoLiberiaLibyaLithuaniaLow & middle incomeLow incomeLower middle incomeLuxembourgMacao SAR, ChinaMacedonia, FYRMadagascarMalawiMalaysiaMaldivesMaliMaltaMarshall IslandsMauritaniaMauritiusMexicoMicronesia, Fed. Sts.Middle East & North AfricaMiddle East & North Africa (excluding high income)Middle East & North Africa (IDA & IBRD countries)Middle incomeMoldovaMongoliaMontenegroMoroccoMozambiqueMyanmarNamibiaNepalNetherlandsNew CaledoniaNew ZealandNicaraguaNigerNigeriaNorth AmericaNorwayOECD membersOmanOther small statesPacific island small statesPakistanPalauPanamaPapua New GuineaParaguayPeruPhilippinesPolandPortugalPost-demographic dividendPre-demographic dividendQatarRomaniaRussian FederationRwandaSamoaSao Tome and PrincipeSaudi ArabiaSenegalSerbiaSeychellesSierra LeoneSingaporeSlovak RepublicSloveniaSmall statesSolomon IslandsSouth AfricaSouth AsiaSouth Asia (IDA & IBRD)SpainSri LankaSt. Kitts and NevisSt. LuciaSt. Vincent and the GrenadinesSub-Saharan Africa Sub-Saharan Africa (excluding high income)Sub-Saharan Africa (IDA & IBRD countries)SudanSurinameSwazilandSwedenSwitzerlandSyrian Arab RepublicTajikistanTanzaniaThailandTimor-LesteTogoTongaTrinidad and TobagoTunisiaTurkeyTurkmenistanTuvaluUgandaUkraineUnited Arab EmiratesUnited KingdomUnited StatesUpper middle incomeUruguayUzbekistanVanuatuVenezuela, RBVietnamWorldYemen, Rep.ZambiaZimbabwe Timeline:
This timeline shows a graph from 1961 to 2016 of Small states. No data until 1960. Number of actual observations by date: 56.
Source name:
World Development Indicators
Source organization:
World Trade Organization, and World Bank GDP estimates.
Categories, topics:
Private Sector, Trade
Last updated:
apr 23, 2017
Indicators value changes by year
Minimum:
69.825
jan 1, 2016
Maximum:
118.564
jan 1, 1975
At the date of observation
Value
Absolute change
Change from previous value
jan 1, 1961
74.485
+74.485
0.0%
jan 1, 1962
74.771
+0.286
0.38%
jan 1, 1963
74.138
-0.633
-0.85%
jan 1, 1964
79.711
+5.572
7.52%
jan 1, 1965
78.401
-1.31
-1.64%
jan 1, 1966
75.598
-2.803
-3.58%
jan 1, 1967
74.147
-1.451
-1.92%
jan 1, 1968
72.314
-1.834
-2.47%
jan 1, 1969
76.204
+3.89
5.38%
jan 1, 1970
80.985
+4.781
6.27%
jan 1, 1971
83.212
+2.227
2.75%
jan 1, 1972
93.289
+10.077
12.11%
jan 1, 1973
86.502
-6.788
-7.28%
jan 1, 1974
90.6
+4.099
4.74%
jan 1, 1975
118.564
+27.964
30.86%
jan 1, 1976
117.397
-1.167
-0.98%
jan 1, 1977
117.985
+0.589
0.5%
jan 1, 1978
115.466
-2.519
-2.14%
jan 1, 1979
111.133
-4.333
-3.75%
jan 1, 1980
112.868
+1.735
1.56%
jan 1, 1981
117.145
+4.277
3.79%
jan 1, 1982
108.006
-9.14
-7.8%
jan 1, 1983
100.36
-7.646
-7.08%
jan 1, 1984
92.281
-8.079
-8.05%
jan 1, 1985
90.238
-2.043
-2.21%
jan 1, 1986
82.839
-7.399
-8.2%
jan 1, 1987
76.074
-6.765
-8.17%
jan 1, 1988
75.595
-0.479
-0.63%
jan 1, 1989
73.317
-2.278
-3.01%
jan 1, 1990
80.249
+6.932
9.45%
jan 1, 1991
81.622
+1.373
1.71%
jan 1, 1992
82.652
+1.031
1.26%
jan 1, 1993
77.022
-5.63
-6.81%
jan 1, 1994
77.197
+0.175
0.23%
jan 1, 1995
76.273
-0.925
-1.2%
jan 1, 1996
79.912
+3.64
4.77%
jan 1, 1997
81.679
+1.767
2.21%
jan 1, 1998
82.062
+0.382
0.47%
jan 1, 1999
76.626
-5.435
-6.62%
jan 1, 2000
74.922
-1.704
-2.22%
jan 1, 2001
79.705
+4.783
6.38%
jan 1, 2002
77.822
-1.883
-2.36%
jan 1, 2003
74.986
-2.836
-3.64%
jan 1, 2004
74.951
-0.035
-0.05%
jan 1, 2005
75.459
+0.508
0.68%
jan 1, 2006
79.051
+3.592
4.76%
jan 1, 2007
83.301
+4.251
5.38%
jan 1, 2008
81.415
-1.886
-2.26%
jan 1, 2009
85.566
+4.151
5.1%
jan 1, 2010
73.439
-12.127
-14.17%
jan 1, 2011
78.129
+4.69
6.39%
jan 1, 2012
85.271
+7.141
9.14%
jan 1, 2013
86.881
+1.61
1.89%
jan 1, 2014
84.57
-2.311
-2.66%
jan 1, 2015
79.494
-5.076
-6.0%
jan 1, 2016
69.825
-9.669
-12.16%
Ranking of countries by current statistics by years


Comments: