29
/
en
AIzaSyAYiBZKx7MnpbEhh9jyipgxe19OcubqV5w
April 1, 2024
151816
Hong Kong SAR, China
HKG
true
2
1
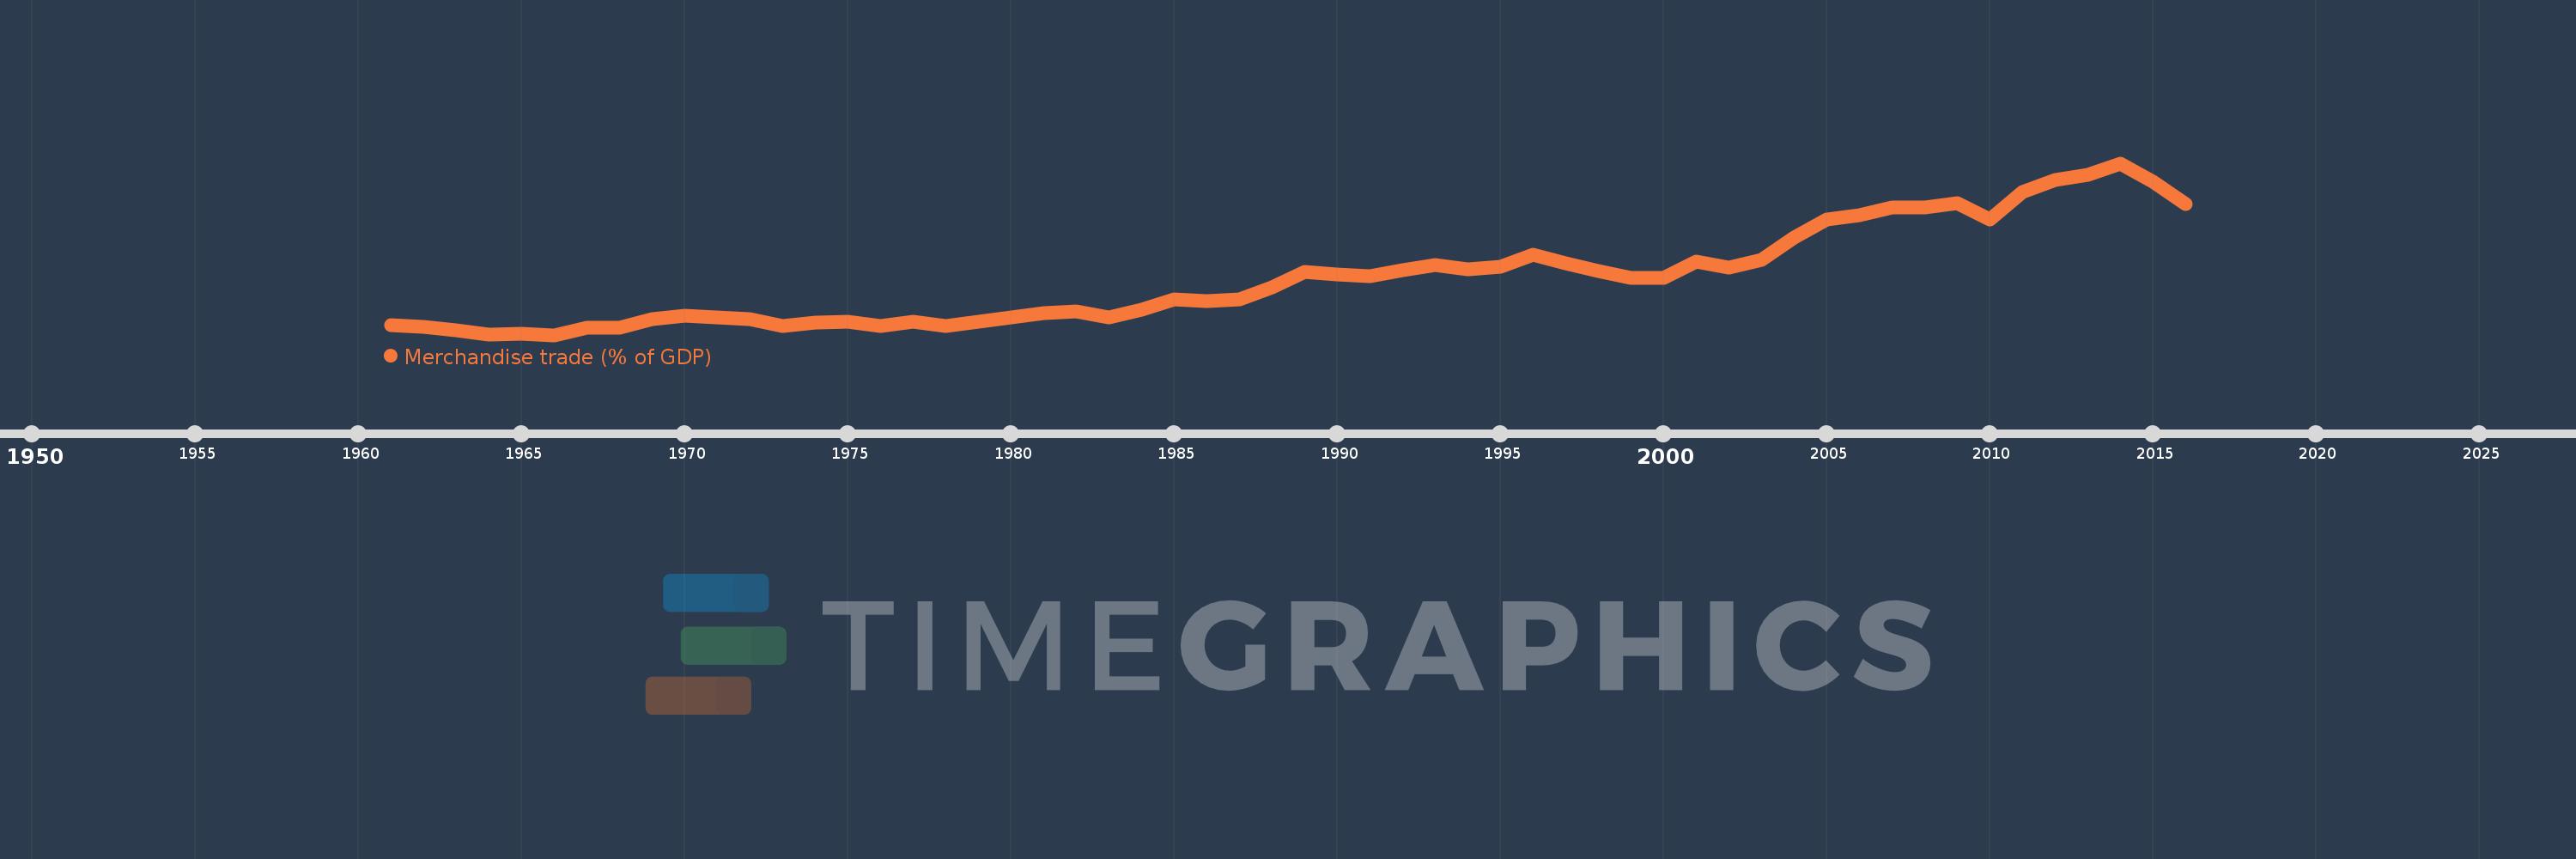
Merchandise trade (% of GDP)
2016,2015,2014,2013,2012,2011,2010,2009,2008,2007,2006,2005,2004,2003,2002,2001,2000,1999,1998,1997,1996,1995,1994,1993,1992,1991,1990,1989,1988,1987,1986,1985,1984,1983,1982,1981,1980,1979,1978,1977,1976,1975,1974,1973,1972,1971,1970,1969,1968,1967,1966,1965,1964,1963,1962,1961
This statistics in other country:
AfghanistanAlbaniaAlgeriaAngolaAntigua and BarbudaArab WorldArgentinaArmeniaArubaAustraliaAustriaAzerbaijanBahamas, TheBahrainBangladeshBarbadosBelarusBelgiumBelizeBeninBermudaBhutanBoliviaBosnia and HerzegovinaBotswanaBrazilBrunei DarussalamBulgariaBurkina FasoBurundiCabo VerdeCambodiaCameroonCanadaCaribbean small statesCentral African RepublicCentral Europe and the BalticsChadChileChinaColombiaComorosCongo, Dem. Rep.Congo, Rep.Costa RicaCote d'IvoireCroatiaCubaCyprusCzech RepublicDenmarkDjiboutiDominicaDominican RepublicEarly-demographic dividendEast Asia & PacificEast Asia & Pacific (excluding high income)East Asia & Pacific (IDA & IBRD countries)EcuadorEgypt, Arab Rep.El SalvadorEquatorial GuineaEritreaEstoniaEthiopiaEuro areaEurope & Central AsiaEurope & Central Asia (excluding high income)Europe & Central Asia (IDA & IBRD countries)European UnionFaroe IslandsFijiFinlandFragile and conflict affected situationsFranceFrench PolynesiaGabonGambia, TheGeorgiaGermanyGhanaGreeceGreenlandGrenadaGuatemalaGuineaGuinea-BissauGuyanaHaitiHeavily indebted poor countries (HIPC)High incomeHondurasHong Kong SAR, ChinaHungaryIBRD onlyIcelandIDA & IBRD totalIDA blendIDA onlyIDA totalIndiaIndonesiaIran, Islamic Rep.IraqIrelandIsraelItalyJamaicaJapanJordanKazakhstanKenyaKiribatiKorea, Rep.KuwaitKyrgyz RepublicLao PDRLate-demographic dividendLatin America & Caribbean Latin America & Caribbean (excluding high income)Latin America & the Caribbean (IDA & IBRD countries)LatviaLeast developed countries: UN classificationLebanonLesothoLiberiaLibyaLithuaniaLow & middle incomeLow incomeLower middle incomeLuxembourgMacao SAR, ChinaMacedonia, FYRMadagascarMalawiMalaysiaMaldivesMaliMaltaMarshall IslandsMauritaniaMauritiusMexicoMicronesia, Fed. Sts.Middle East & North AfricaMiddle East & North Africa (excluding high income)Middle East & North Africa (IDA & IBRD countries)Middle incomeMoldovaMongoliaMontenegroMoroccoMozambiqueMyanmarNamibiaNepalNetherlandsNew CaledoniaNew ZealandNicaraguaNigerNigeriaNorth AmericaNorwayOECD membersOmanOther small statesPacific island small statesPakistanPalauPanamaPapua New GuineaParaguayPeruPhilippinesPolandPortugalPost-demographic dividendPre-demographic dividendQatarRomaniaRussian FederationRwandaSamoaSao Tome and PrincipeSaudi ArabiaSenegalSerbiaSeychellesSierra LeoneSingaporeSlovak RepublicSloveniaSmall statesSolomon IslandsSouth AfricaSouth AsiaSouth Asia (IDA & IBRD)SpainSri LankaSt. Kitts and NevisSt. LuciaSt. Vincent and the GrenadinesSub-Saharan Africa Sub-Saharan Africa (excluding high income)Sub-Saharan Africa (IDA & IBRD countries)SudanSurinameSwazilandSwedenSwitzerlandSyrian Arab RepublicTajikistanTanzaniaThailandTimor-LesteTogoTongaTrinidad and TobagoTunisiaTurkeyTurkmenistanTuvaluUgandaUkraineUnited Arab EmiratesUnited KingdomUnited StatesUpper middle incomeUruguayUzbekistanVanuatuVenezuela, RBVietnamWorldYemen, Rep.ZambiaZimbabwe Timeline:
This timeline shows a graph from 1961 to 2016 of Hong Kong SAR, China. No data until 1960. Number of actual observations by date: 56.
Source name:
World Development Indicators
Source organization:
World Trade Organization, and World Bank GDP estimates.
Categories, topics:
Private Sector, Trade
Last updated:
apr 23, 2017
Indicators value changes by year
Minimum:
111.357
jan 1, 1966
Maximum:
419.578
jan 1, 2014
At the date of observation
Value
Absolute change
Change from previous value
jan 1, 1961
129.846
+129.846
0.0%
jan 1, 1962
125.247
-4.598
-3.54%
jan 1, 1963
119.901
-5.346
-4.27%
jan 1, 1964
112.154
-7.747
-6.46%
jan 1, 1965
113.678
+1.524
1.36%
jan 1, 1966
111.357
-2.322
-2.04%
jan 1, 1967
124.124
+12.767
11.47%
jan 1, 1968
124.243
+0.119
0.1%
jan 1, 1969
139.927
+15.684
12.62%
jan 1, 1970
145.3
+5.373
3.84%
jan 1, 1971
142.596
-2.703
-1.86%
jan 1, 1972
139.983
-2.614
-1.83%
jan 1, 1973
127.712
-12.271
-8.77%
jan 1, 1974
133.58
+5.869
4.6%
jan 1, 1975
135.759
+2.179
1.63%
jan 1, 1976
127.314
-8.446
-6.22%
jan 1, 1977
134.526
+7.212
5.66%
jan 1, 1978
127.629
-6.897
-5.13%
jan 1, 1979
135.661
+8.032
6.29%
jan 1, 1980
143.243
+7.582
5.59%
jan 1, 1981
150.084
+6.842
4.78%
jan 1, 1982
154.276
+4.191
2.79%
jan 1, 1983
143.104
-11.172
-7.24%
jan 1, 1984
156.695
+13.592
9.5%
jan 1, 1985
175.406
+18.711
11.94%
jan 1, 1986
171.632
-3.774
-2.15%
jan 1, 1987
175.343
+3.71
2.16%
jan 1, 1988
196.361
+21.018
11.99%
jan 1, 1989
224.123
+27.762
14.14%
jan 1, 1990
219.505
-4.618
-2.06%
jan 1, 1991
217.235
-2.27
-1.03%
jan 1, 1992
227.679
+10.444
4.81%
jan 1, 1993
236.809
+9.13
4.01%
jan 1, 1994
229.899
-6.909
-2.92%
jan 1, 1995
233.663
+3.764
1.64%
jan 1, 1996
255.745
+22.082
9.45%
jan 1, 1997
239.297
-16.449
-6.43%
jan 1, 1998
226.38
-12.916
-5.4%
jan 1, 1999
214.122
-12.258
-5.41%
jan 1, 2000
214.223
+0.101
0.05%
jan 1, 2001
242.75
+28.527
13.32%
jan 1, 2002
232.035
-10.716
-4.41%
jan 1, 2003
246.407
+14.373
6.19%
jan 1, 2004
286.246
+39.839
16.17%
jan 1, 2005
318.413
+32.167
11.24%
jan 1, 2006
326.199
+7.786
2.45%
jan 1, 2007
340.206
+14.008
4.29%
jan 1, 2008
340.041
-0.165
-0.05%
jan 1, 2009
348.051
+8.01
2.36%
jan 1, 2010
318.465
-29.586
-8.5%
jan 1, 2011
368.295
+49.83
15.65%
jan 1, 2012
388.883
+20.588
5.59%
jan 1, 2013
398.43
+9.546
2.45%
jan 1, 2014
419.578
+21.148
5.31%
jan 1, 2015
386.184
-33.394
-7.96%
jan 1, 2016
346.023
-40.161
-10.4%
Ranking of countries by current statistics by years


Comments: