29
/
en
AIzaSyAYiBZKx7MnpbEhh9jyipgxe19OcubqV5w
April 1, 2024
55723
Pre-demographic dividend
PRE
false
2
1
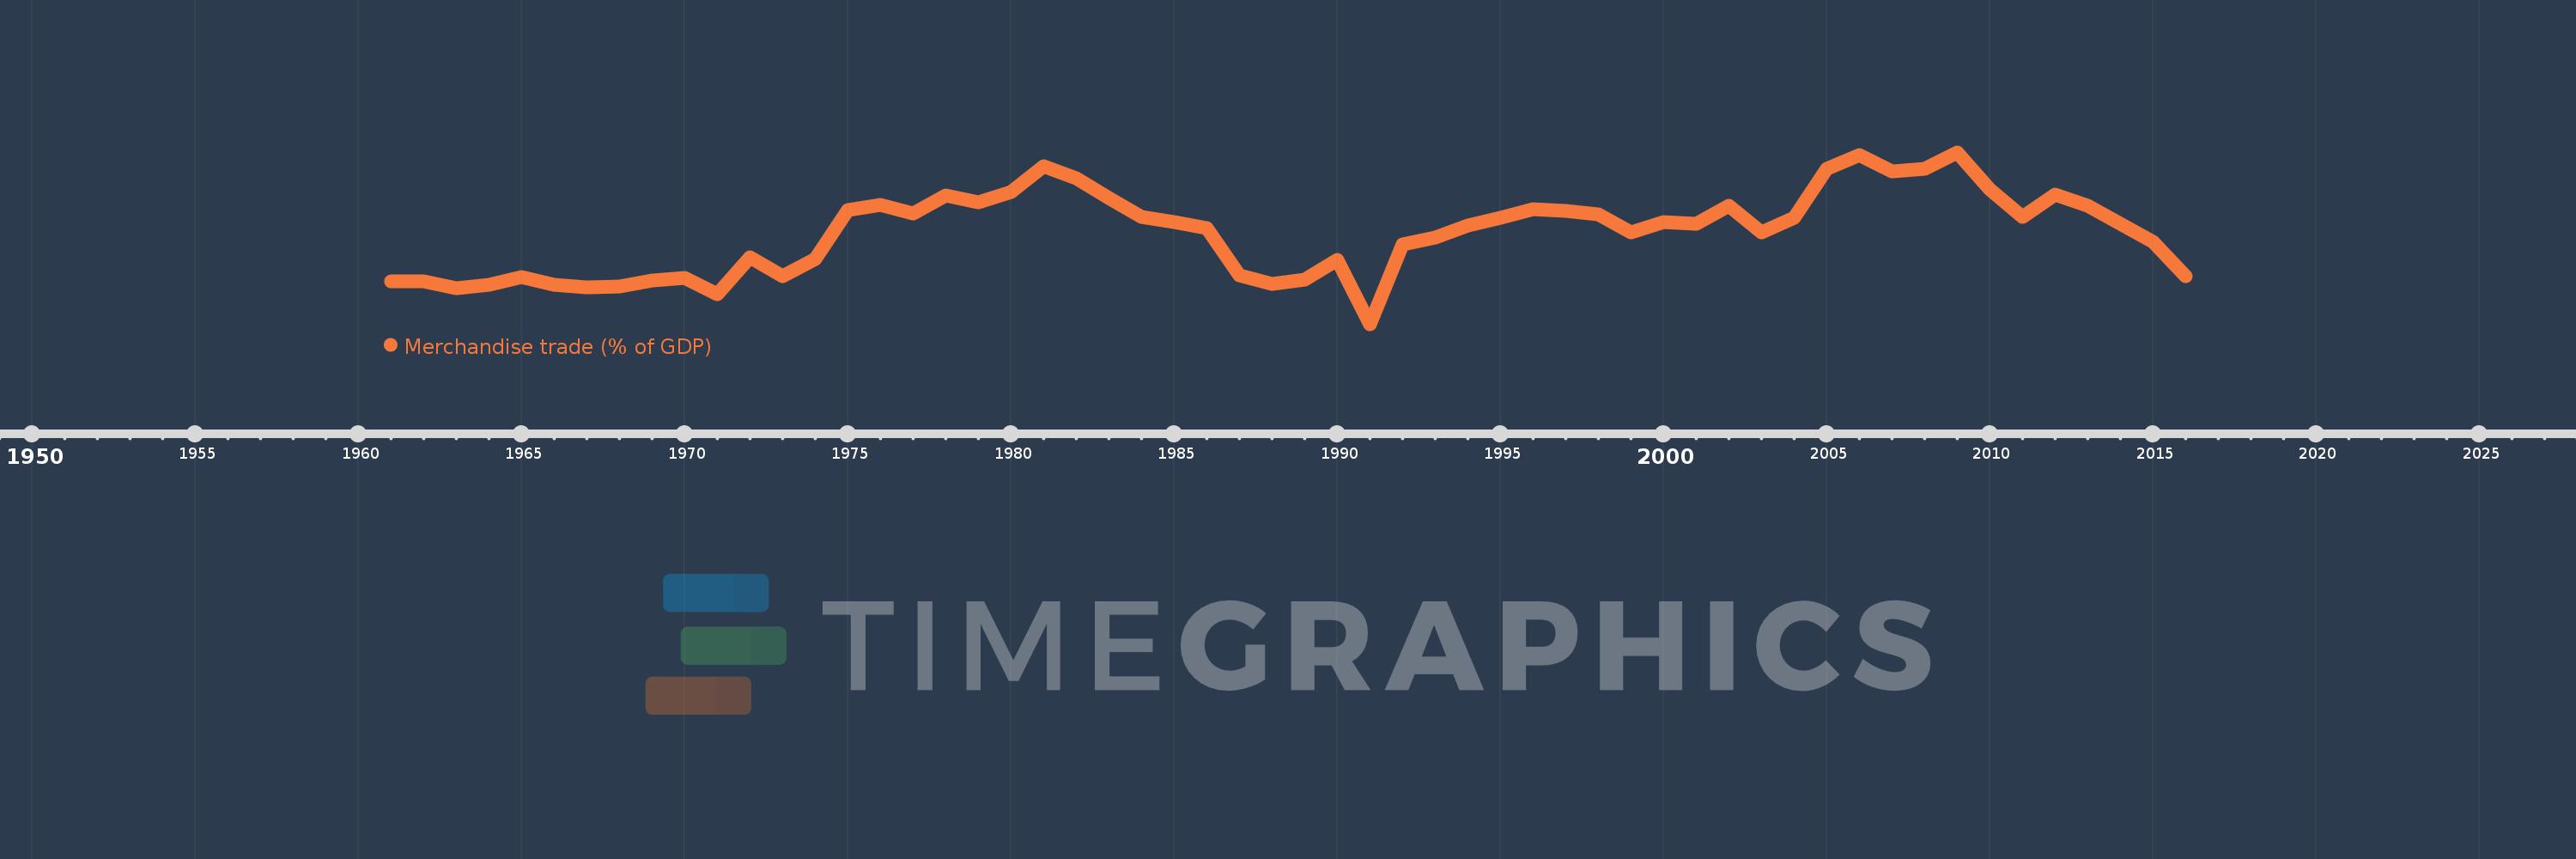
Merchandise trade (% of GDP)
2016,2015,2014,2013,2012,2011,2010,2009,2008,2007,2006,2005,2004,2003,2002,2001,2000,1999,1998,1997,1996,1995,1994,1993,1992,1991,1990,1989,1988,1987,1986,1985,1984,1983,1982,1981,1980,1979,1978,1977,1976,1975,1974,1973,1972,1971,1970,1969,1968,1967,1966,1965,1964,1963,1962,1961
This statistics in other country:
AfghanistanAlbaniaAlgeriaAngolaAntigua and BarbudaArab WorldArgentinaArmeniaArubaAustraliaAustriaAzerbaijanBahamas, TheBahrainBangladeshBarbadosBelarusBelgiumBelizeBeninBermudaBhutanBoliviaBosnia and HerzegovinaBotswanaBrazilBrunei DarussalamBulgariaBurkina FasoBurundiCabo VerdeCambodiaCameroonCanadaCaribbean small statesCentral African RepublicCentral Europe and the BalticsChadChileChinaColombiaComorosCongo, Dem. Rep.Congo, Rep.Costa RicaCote d'IvoireCroatiaCubaCyprusCzech RepublicDenmarkDjiboutiDominicaDominican RepublicEarly-demographic dividendEast Asia & PacificEast Asia & Pacific (excluding high income)East Asia & Pacific (IDA & IBRD countries)EcuadorEgypt, Arab Rep.El SalvadorEquatorial GuineaEritreaEstoniaEthiopiaEuro areaEurope & Central AsiaEurope & Central Asia (excluding high income)Europe & Central Asia (IDA & IBRD countries)European UnionFaroe IslandsFijiFinlandFragile and conflict affected situationsFranceFrench PolynesiaGabonGambia, TheGeorgiaGermanyGhanaGreeceGreenlandGrenadaGuatemalaGuineaGuinea-BissauGuyanaHaitiHeavily indebted poor countries (HIPC)High incomeHondurasHong Kong SAR, ChinaHungaryIBRD onlyIcelandIDA & IBRD totalIDA blendIDA onlyIDA totalIndiaIndonesiaIran, Islamic Rep.IraqIrelandIsraelItalyJamaicaJapanJordanKazakhstanKenyaKiribatiKorea, Rep.KuwaitKyrgyz RepublicLao PDRLate-demographic dividendLatin America & Caribbean Latin America & Caribbean (excluding high income)Latin America & the Caribbean (IDA & IBRD countries)LatviaLeast developed countries: UN classificationLebanonLesothoLiberiaLibyaLithuaniaLow & middle incomeLow incomeLower middle incomeLuxembourgMacao SAR, ChinaMacedonia, FYRMadagascarMalawiMalaysiaMaldivesMaliMaltaMarshall IslandsMauritaniaMauritiusMexicoMicronesia, Fed. Sts.Middle East & North AfricaMiddle East & North Africa (excluding high income)Middle East & North Africa (IDA & IBRD countries)Middle incomeMoldovaMongoliaMontenegroMoroccoMozambiqueMyanmarNamibiaNepalNetherlandsNew CaledoniaNew ZealandNicaraguaNigerNigeriaNorth AmericaNorwayOECD membersOmanOther small statesPacific island small statesPakistanPalauPanamaPapua New GuineaParaguayPeruPhilippinesPolandPortugalPost-demographic dividendPre-demographic dividendQatarRomaniaRussian FederationRwandaSamoaSao Tome and PrincipeSaudi ArabiaSenegalSerbiaSeychellesSierra LeoneSingaporeSlovak RepublicSloveniaSmall statesSolomon IslandsSouth AfricaSouth AsiaSouth Asia (IDA & IBRD)SpainSri LankaSt. Kitts and NevisSt. LuciaSt. Vincent and the GrenadinesSub-Saharan Africa Sub-Saharan Africa (excluding high income)Sub-Saharan Africa (IDA & IBRD countries)SudanSurinameSwazilandSwedenSwitzerlandSyrian Arab RepublicTajikistanTanzaniaThailandTimor-LesteTogoTongaTrinidad and TobagoTunisiaTurkeyTurkmenistanTuvaluUgandaUkraineUnited Arab EmiratesUnited KingdomUnited StatesUpper middle incomeUruguayUzbekistanVanuatuVenezuela, RBVietnamWorldYemen, Rep.ZambiaZimbabwe Timeline:
This timeline shows a graph from 1961 to 2016 of Pre-demographic dividend. No data until 1960. Number of actual observations by date: 56.
Source name:
World Development Indicators
Source organization:
World Trade Organization, and World Bank GDP estimates.
Categories, topics:
Private Sector, Trade
Last updated:
apr 23, 2017
Indicators value changes by year
Minimum:
24.809
jan 1, 1991
Maximum:
64.743
jan 1, 2009
At the date of observation
Value
Absolute change
Change from previous value
jan 1, 1961
34.729
+34.729
0.0%
jan 1, 1962
34.829
+0.1
0.29%
jan 1, 1963
33.224
-1.605
-4.61%
jan 1, 1964
34.03
+0.806
2.43%
jan 1, 1965
35.793
+1.763
5.18%
jan 1, 1966
33.914
-1.879
-5.25%
jan 1, 1967
33.394
-0.52
-1.53%
jan 1, 1968
33.53
+0.136
0.41%
jan 1, 1969
35.03
+1.5
4.47%
jan 1, 1970
35.579
+0.549
1.57%
jan 1, 1971
31.81
-3.769
-10.59%
jan 1, 1972
40.308
+8.498
26.72%
jan 1, 1973
35.906
-4.403
-10.92%
jan 1, 1974
39.983
+4.077
11.35%
jan 1, 1975
51.309
+11.326
28.33%
jan 1, 1976
52.589
+1.28
2.49%
jan 1, 1977
50.458
-2.131
-4.05%
jan 1, 1978
54.698
+4.24
8.4%
jan 1, 1979
53.2
-1.498
-2.74%
jan 1, 1980
55.554
+2.354
4.43%
jan 1, 1981
61.476
+5.922
10.66%
jan 1, 1982
58.656
-2.82
-4.59%
jan 1, 1983
54.209
-4.447
-7.58%
jan 1, 1984
49.725
-4.484
-8.27%
jan 1, 1985
48.53
-1.195
-2.4%
jan 1, 1986
47.124
-1.405
-2.9%
jan 1, 1987
36.268
-10.857
-23.04%
jan 1, 1988
34.156
-2.112
-5.82%
jan 1, 1989
35.083
+0.927
2.71%
jan 1, 1990
39.734
+4.651
13.26%
jan 1, 1991
24.809
-14.925
-37.56%
jan 1, 1992
43.342
+18.533
74.71%
jan 1, 1993
44.896
+1.554
3.59%
jan 1, 1994
47.666
+2.77
6.17%
jan 1, 1995
49.496
+1.83
3.84%
jan 1, 1996
51.461
+1.965
3.97%
jan 1, 1997
51.168
-0.293
-0.57%
jan 1, 1998
50.315
-0.853
-1.67%
jan 1, 1999
46.193
-4.122
-8.19%
jan 1, 2000
48.491
+2.298
4.98%
jan 1, 2001
48.158
-0.333
-0.69%
jan 1, 2002
52.402
+4.244
8.81%
jan 1, 2003
46.123
-6.28
-11.98%
jan 1, 2004
49.491
+3.368
7.3%
jan 1, 2005
61.018
+11.528
23.29%
jan 1, 2006
64.187
+3.169
5.19%
jan 1, 2007
60.286
-3.901
-6.08%
jan 1, 2008
60.836
+0.55
0.91%
jan 1, 2009
64.743
+3.906
6.42%
jan 1, 2010
56.169
-8.574
-13.24%
jan 1, 2011
49.749
-6.42
-11.43%
jan 1, 2012
55.009
+5.26
10.57%
jan 1, 2013
52.252
-2.757
-5.01%
jan 1, 2014
48.174
-4.077
-7.8%
jan 1, 2015
43.972
-4.202
-8.72%
jan 1, 2016
35.989
-7.983
-18.15%
Ranking of countries by current statistics by years


Comments: