29
/
en
AIzaSyAYiBZKx7MnpbEhh9jyipgxe19OcubqV5w
April 1, 2024
120121
Djibouti
DJI
true
2
1
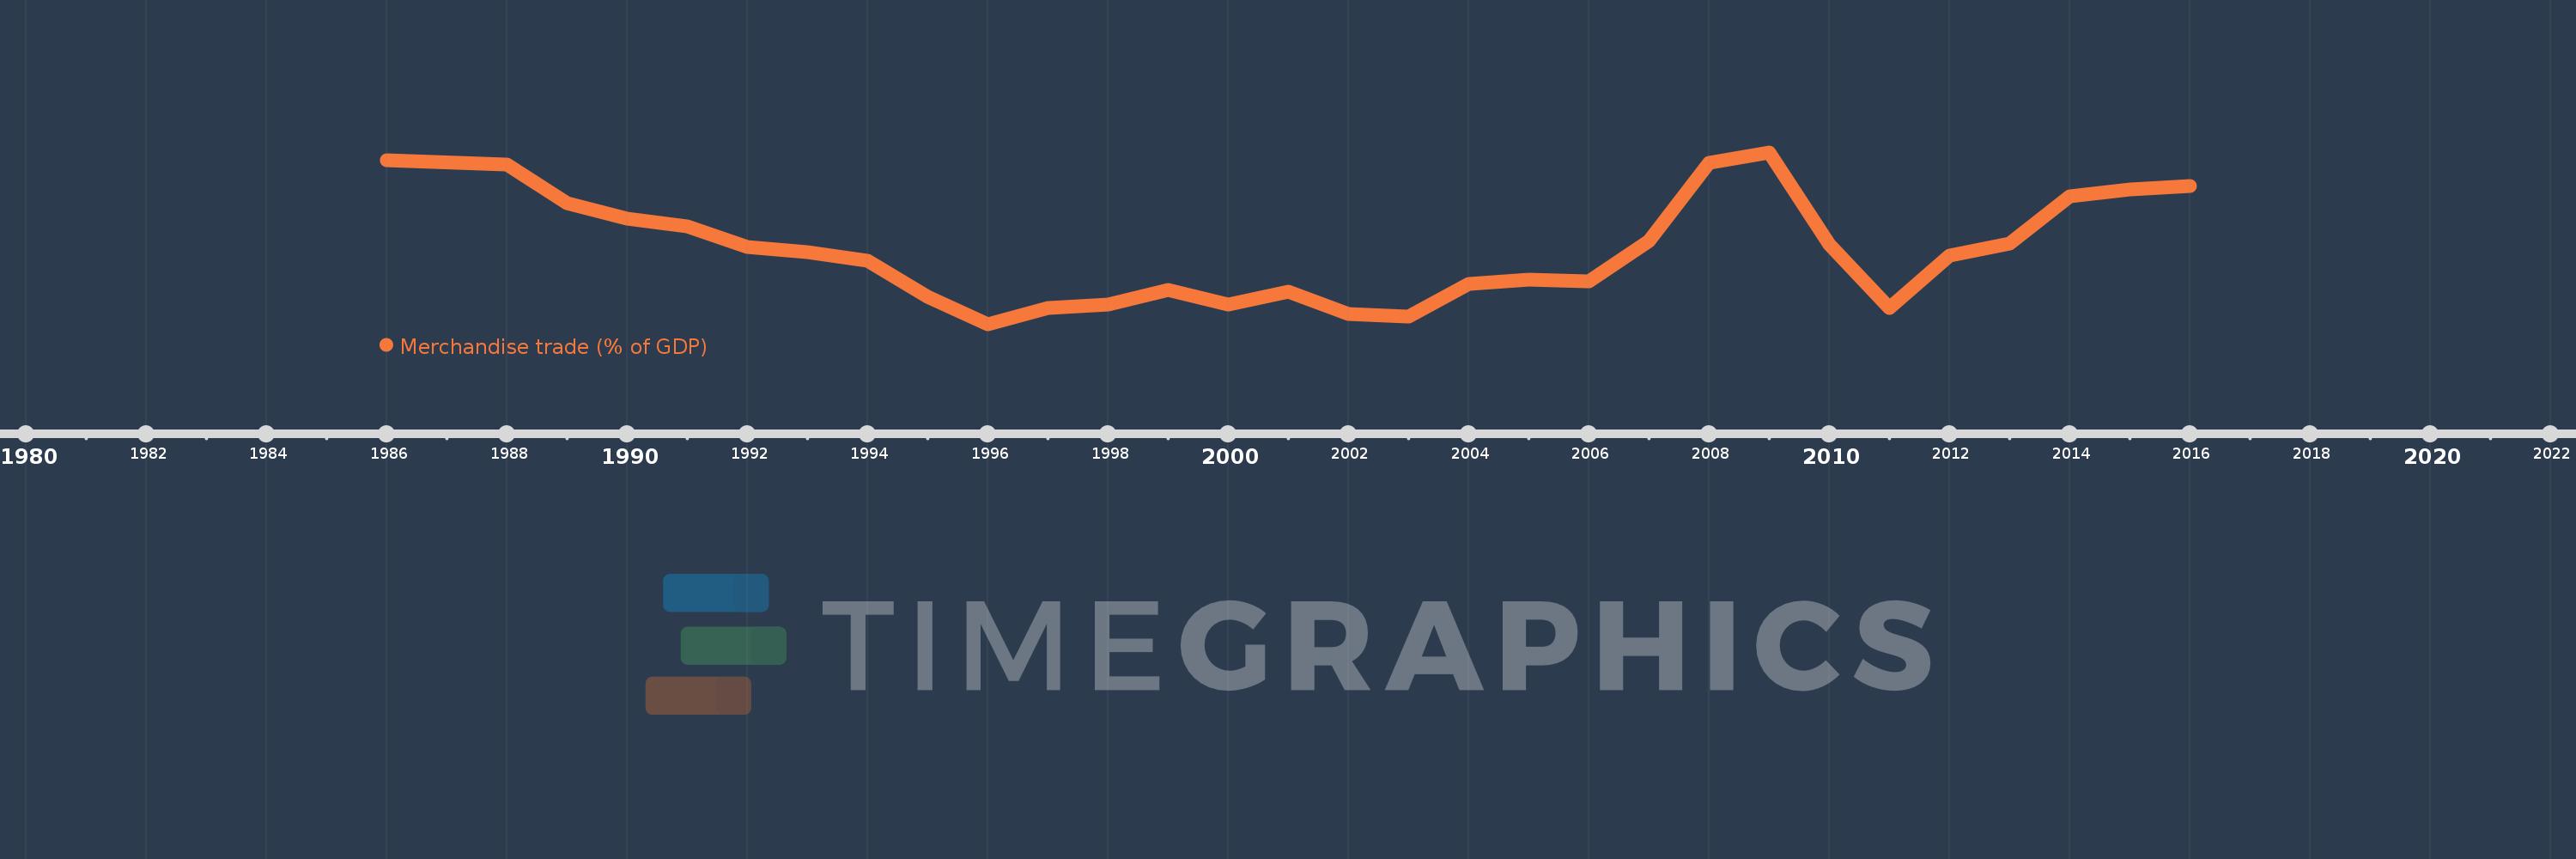
Merchandise trade (% of GDP)
2016,2015,2014,2013,2012,2011,2010,2009,2008,2007,2006,2005,2004,2003,2002,2001,2000,1999,1998,1997,1996,1995,1994,1993,1992,1991,1990,1989,1988,1986
This statistics in other country:
AfghanistanAlbaniaAlgeriaAngolaAntigua and BarbudaArab WorldArgentinaArmeniaArubaAustraliaAustriaAzerbaijanBahamas, TheBahrainBangladeshBarbadosBelarusBelgiumBelizeBeninBermudaBhutanBoliviaBosnia and HerzegovinaBotswanaBrazilBrunei DarussalamBulgariaBurkina FasoBurundiCabo VerdeCambodiaCameroonCanadaCaribbean small statesCentral African RepublicCentral Europe and the BalticsChadChileChinaColombiaComorosCongo, Dem. Rep.Congo, Rep.Costa RicaCote d'IvoireCroatiaCubaCyprusCzech RepublicDenmarkDjiboutiDominicaDominican RepublicEarly-demographic dividendEast Asia & PacificEast Asia & Pacific (excluding high income)East Asia & Pacific (IDA & IBRD countries)EcuadorEgypt, Arab Rep.El SalvadorEquatorial GuineaEritreaEstoniaEthiopiaEuro areaEurope & Central AsiaEurope & Central Asia (excluding high income)Europe & Central Asia (IDA & IBRD countries)European UnionFaroe IslandsFijiFinlandFragile and conflict affected situationsFranceFrench PolynesiaGabonGambia, TheGeorgiaGermanyGhanaGreeceGreenlandGrenadaGuatemalaGuineaGuinea-BissauGuyanaHaitiHeavily indebted poor countries (HIPC)High incomeHondurasHong Kong SAR, ChinaHungaryIBRD onlyIcelandIDA & IBRD totalIDA blendIDA onlyIDA totalIndiaIndonesiaIran, Islamic Rep.IraqIrelandIsraelItalyJamaicaJapanJordanKazakhstanKenyaKiribatiKorea, Rep.KuwaitKyrgyz RepublicLao PDRLate-demographic dividendLatin America & Caribbean Latin America & Caribbean (excluding high income)Latin America & the Caribbean (IDA & IBRD countries)LatviaLeast developed countries: UN classificationLebanonLesothoLiberiaLibyaLithuaniaLow & middle incomeLow incomeLower middle incomeLuxembourgMacao SAR, ChinaMacedonia, FYRMadagascarMalawiMalaysiaMaldivesMaliMaltaMarshall IslandsMauritaniaMauritiusMexicoMicronesia, Fed. Sts.Middle East & North AfricaMiddle East & North Africa (excluding high income)Middle East & North Africa (IDA & IBRD countries)Middle incomeMoldovaMongoliaMontenegroMoroccoMozambiqueMyanmarNamibiaNepalNetherlandsNew CaledoniaNew ZealandNicaraguaNigerNigeriaNorth AmericaNorwayOECD membersOmanOther small statesPacific island small statesPakistanPalauPanamaPapua New GuineaParaguayPeruPhilippinesPolandPortugalPost-demographic dividendPre-demographic dividendQatarRomaniaRussian FederationRwandaSamoaSao Tome and PrincipeSaudi ArabiaSenegalSerbiaSeychellesSierra LeoneSingaporeSlovak RepublicSloveniaSmall statesSolomon IslandsSouth AfricaSouth AsiaSouth Asia (IDA & IBRD)SpainSri LankaSt. Kitts and NevisSt. LuciaSt. Vincent and the GrenadinesSub-Saharan Africa Sub-Saharan Africa (excluding high income)Sub-Saharan Africa (IDA & IBRD countries)SudanSurinameSwazilandSwedenSwitzerlandSyrian Arab RepublicTajikistanTanzaniaThailandTimor-LesteTogoTongaTrinidad and TobagoTunisiaTurkeyTurkmenistanTuvaluUgandaUkraineUnited Arab EmiratesUnited KingdomUnited StatesUpper middle incomeUruguayUzbekistanVanuatuVenezuela, RBVietnamWorldYemen, Rep.ZambiaZimbabwe Timeline:
This timeline shows a graph from 1986 to 2016 of Djibouti. No data until 1985. Number of actual observations by date: 30.
Source name:
World Development Indicators
Source organization:
World Trade Organization, and World Bank GDP estimates.
Categories, topics:
Private Sector, Trade
Last updated:
apr 23, 2017
Indicators value changes by year
Minimum:
38.234
jan 1, 1996
Maximum:
64.292
jan 1, 2009
At the date of observation
Value
Absolute change
Change from previous value
jan 1, 1986
63.052
+63.052
0.0%
jan 1, 1988
62.404
-0.647
-1.03%
jan 1, 1989
56.595
-5.809
-9.31%
jan 1, 1990
54.25
-2.345
-4.14%
jan 1, 1991
53.059
-1.191
-2.19%
jan 1, 1992
49.954
-3.104
-5.85%
jan 1, 1993
49.157
-0.797
-1.6%
jan 1, 1994
47.871
-1.287
-2.62%
jan 1, 1995
42.405
-5.466
-11.42%
jan 1, 1996
38.234
-4.171
-9.84%
jan 1, 1997
40.728
+2.494
6.52%
jan 1, 1998
41.219
+0.491
1.21%
jan 1, 1999
43.46
+2.24
5.44%
jan 1, 2000
41.281
-2.179
-5.01%
jan 1, 2001
43.194
+1.913
4.63%
jan 1, 2002
39.831
-3.363
-7.79%
jan 1, 2003
39.363
-0.468
-1.17%
jan 1, 2004
44.287
+4.923
12.51%
jan 1, 2005
44.941
+0.655
1.48%
jan 1, 2006
44.708
-0.233
-0.52%
jan 1, 2007
50.839
+6.131
13.71%
jan 1, 2008
62.659
+11.82
23.25%
jan 1, 2009
64.292
+1.633
2.61%
jan 1, 2010
50.336
-13.956
-21.71%
jan 1, 2011
40.671
-9.665
-19.2%
jan 1, 2012
48.685
+8.014
19.7%
jan 1, 2013
50.415
+1.73
3.55%
jan 1, 2014
57.668
+7.253
14.39%
jan 1, 2015
58.7
+1.032
1.79%
jan 1, 2016
59.171
+0.471
0.8%
Ranking of countries by current statistics by years


Comments: