29
/
en
AIzaSyAYiBZKx7MnpbEhh9jyipgxe19OcubqV5w
April 1, 2024
51136
Middle income
MIC
false
2
1
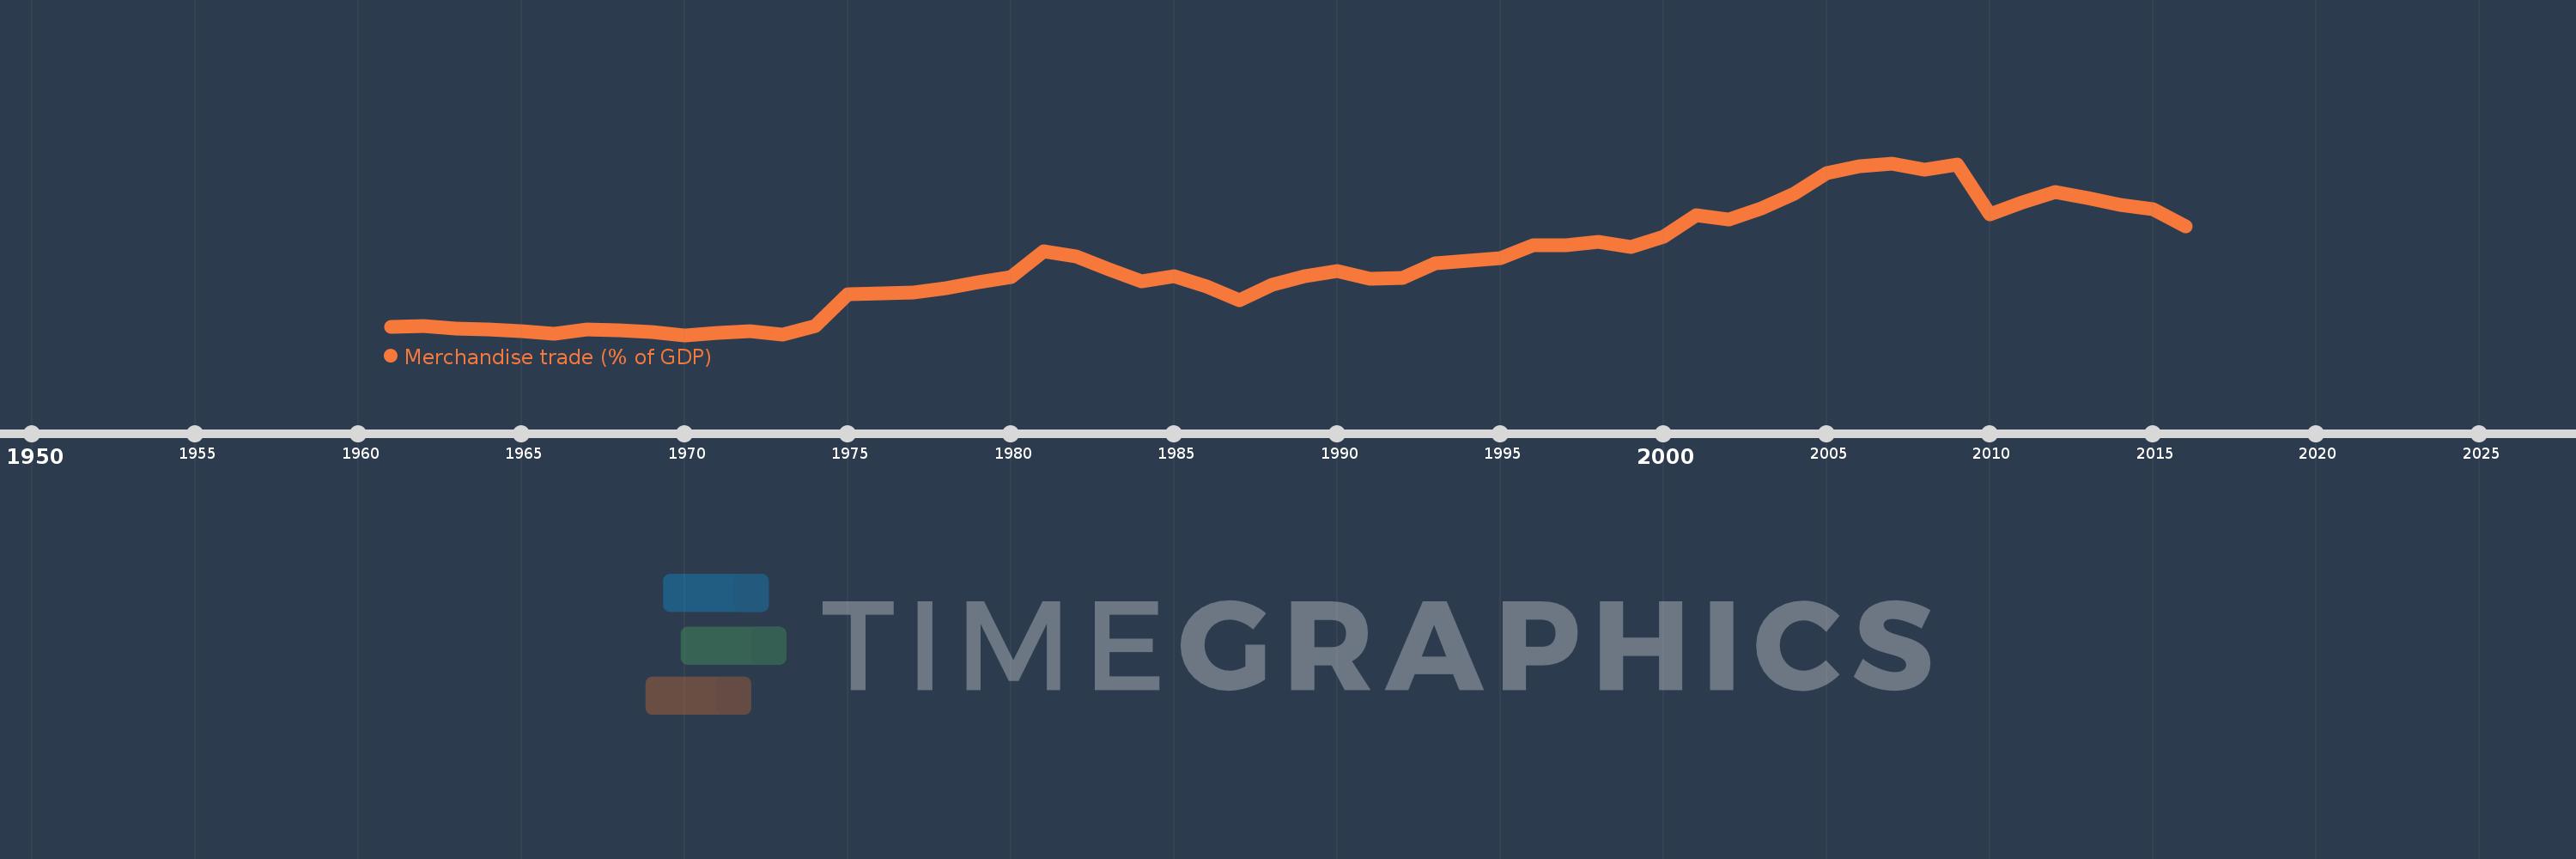
Merchandise trade (% of GDP)
2016,2015,2014,2013,2012,2011,2010,2009,2008,2007,2006,2005,2004,2003,2002,2001,2000,1999,1998,1997,1996,1995,1994,1993,1992,1991,1990,1989,1988,1987,1986,1985,1984,1983,1982,1981,1980,1979,1978,1977,1976,1975,1974,1973,1972,1971,1970,1969,1968,1967,1966,1965,1964,1963,1962,1961
This statistics in other country:
AfghanistanAlbaniaAlgeriaAngolaAntigua and BarbudaArab WorldArgentinaArmeniaArubaAustraliaAustriaAzerbaijanBahamas, TheBahrainBangladeshBarbadosBelarusBelgiumBelizeBeninBermudaBhutanBoliviaBosnia and HerzegovinaBotswanaBrazilBrunei DarussalamBulgariaBurkina FasoBurundiCabo VerdeCambodiaCameroonCanadaCaribbean small statesCentral African RepublicCentral Europe and the BalticsChadChileChinaColombiaComorosCongo, Dem. Rep.Congo, Rep.Costa RicaCote d'IvoireCroatiaCubaCyprusCzech RepublicDenmarkDjiboutiDominicaDominican RepublicEarly-demographic dividendEast Asia & PacificEast Asia & Pacific (excluding high income)East Asia & Pacific (IDA & IBRD countries)EcuadorEgypt, Arab Rep.El SalvadorEquatorial GuineaEritreaEstoniaEthiopiaEuro areaEurope & Central AsiaEurope & Central Asia (excluding high income)Europe & Central Asia (IDA & IBRD countries)European UnionFaroe IslandsFijiFinlandFragile and conflict affected situationsFranceFrench PolynesiaGabonGambia, TheGeorgiaGermanyGhanaGreeceGreenlandGrenadaGuatemalaGuineaGuinea-BissauGuyanaHaitiHeavily indebted poor countries (HIPC)High incomeHondurasHong Kong SAR, ChinaHungaryIBRD onlyIcelandIDA & IBRD totalIDA blendIDA onlyIDA totalIndiaIndonesiaIran, Islamic Rep.IraqIrelandIsraelItalyJamaicaJapanJordanKazakhstanKenyaKiribatiKorea, Rep.KuwaitKyrgyz RepublicLao PDRLate-demographic dividendLatin America & Caribbean Latin America & Caribbean (excluding high income)Latin America & the Caribbean (IDA & IBRD countries)LatviaLeast developed countries: UN classificationLebanonLesothoLiberiaLibyaLithuaniaLow & middle incomeLow incomeLower middle incomeLuxembourgMacao SAR, ChinaMacedonia, FYRMadagascarMalawiMalaysiaMaldivesMaliMaltaMarshall IslandsMauritaniaMauritiusMexicoMicronesia, Fed. Sts.Middle East & North AfricaMiddle East & North Africa (excluding high income)Middle East & North Africa (IDA & IBRD countries)Middle incomeMoldovaMongoliaMontenegroMoroccoMozambiqueMyanmarNamibiaNepalNetherlandsNew CaledoniaNew ZealandNicaraguaNigerNigeriaNorth AmericaNorwayOECD membersOmanOther small statesPacific island small statesPakistanPalauPanamaPapua New GuineaParaguayPeruPhilippinesPolandPortugalPost-demographic dividendPre-demographic dividendQatarRomaniaRussian FederationRwandaSamoaSao Tome and PrincipeSaudi ArabiaSenegalSerbiaSeychellesSierra LeoneSingaporeSlovak RepublicSloveniaSmall statesSolomon IslandsSouth AfricaSouth AsiaSouth Asia (IDA & IBRD)SpainSri LankaSt. Kitts and NevisSt. LuciaSt. Vincent and the GrenadinesSub-Saharan Africa Sub-Saharan Africa (excluding high income)Sub-Saharan Africa (IDA & IBRD countries)SudanSurinameSwazilandSwedenSwitzerlandSyrian Arab RepublicTajikistanTanzaniaThailandTimor-LesteTogoTongaTrinidad and TobagoTunisiaTurkeyTurkmenistanTuvaluUgandaUkraineUnited Arab EmiratesUnited KingdomUnited StatesUpper middle incomeUruguayUzbekistanVanuatuVenezuela, RBVietnamWorldYemen, Rep.ZambiaZimbabwe Timeline:
This timeline shows a graph from 1961 to 2016 of Middle income. No data until 1960. Number of actual observations by date: 56.
Source name:
World Development Indicators
Source organization:
World Trade Organization, and World Bank GDP estimates.
Categories, topics:
Private Sector, Trade
Last updated:
apr 23, 2017
Indicators value changes by year
Minimum:
18.137
jan 1, 1970
Maximum:
54.556
jan 1, 2007
At the date of observation
Value
Absolute change
Change from previous value
jan 1, 1961
19.798
+19.798
0.0%
jan 1, 1962
20.056
+0.258
1.3%
jan 1, 1963
19.49
-0.566
-2.82%
jan 1, 1964
19.307
-0.183
-0.94%
jan 1, 1965
19.037
-0.27
-1.4%
jan 1, 1966
18.371
-0.666
-3.5%
jan 1, 1967
19.264
+0.893
4.86%
jan 1, 1968
19.116
-0.148
-0.77%
jan 1, 1969
18.804
-0.311
-1.63%
jan 1, 1970
18.137
-0.667
-3.55%
jan 1, 1971
18.577
+0.44
2.43%
jan 1, 1972
19.037
+0.46
2.48%
jan 1, 1973
18.22
-0.818
-4.3%
jan 1, 1974
20.138
+1.918
10.53%
jan 1, 1975
26.769
+6.632
32.93%
jan 1, 1976
26.883
+0.113
0.42%
jan 1, 1977
27.071
+0.188
0.7%
jan 1, 1978
28.012
+0.941
3.48%
jan 1, 1979
29.259
+1.247
4.45%
jan 1, 1980
30.401
+1.142
3.9%
jan 1, 1981
35.894
+5.493
18.07%
jan 1, 1982
34.756
-1.139
-3.17%
jan 1, 1983
32.054
-2.702
-7.77%
jan 1, 1984
29.601
-2.453
-7.65%
jan 1, 1985
30.569
+0.969
3.27%
jan 1, 1986
28.429
-2.14
-7.0%
jan 1, 1987
25.563
-2.866
-10.08%
jan 1, 1988
28.699
+3.136
12.27%
jan 1, 1989
30.683
+1.984
6.91%
jan 1, 1990
31.75
+1.067
3.48%
jan 1, 1991
30.028
-1.722
-5.42%
jan 1, 1992
30.25
+0.222
0.74%
jan 1, 1993
33.362
+3.112
10.29%
jan 1, 1994
33.947
+0.585
1.75%
jan 1, 1995
34.501
+0.553
1.63%
jan 1, 1996
37.233
+2.733
7.92%
jan 1, 1997
37.146
-0.088
-0.24%
jan 1, 1998
37.838
+0.692
1.86%
jan 1, 1999
36.722
-1.116
-2.95%
jan 1, 2000
39.019
+2.297
6.26%
jan 1, 2001
43.477
+4.458
11.43%
jan 1, 2002
42.566
-0.911
-2.1%
jan 1, 2003
45.031
+2.465
5.79%
jan 1, 2004
48.015
+2.983
6.63%
jan 1, 2005
52.399
+4.385
9.13%
jan 1, 2006
53.886
+1.487
2.84%
jan 1, 2007
54.556
+0.67
1.24%
jan 1, 2008
53.143
-1.414
-2.59%
jan 1, 2009
54.279
+1.137
2.14%
jan 1, 2010
43.641
-10.638
-19.6%
jan 1, 2011
46.319
+2.678
6.14%
jan 1, 2012
48.472
+2.153
4.65%
jan 1, 2013
47.218
-1.254
-2.59%
jan 1, 2014
45.782
-1.436
-3.04%
jan 1, 2015
44.73
-1.052
-2.3%
jan 1, 2016
41.235
-3.495
-7.81%
Ranking of countries by current statistics by years


Comments: