29
/
en
AIzaSyAYiBZKx7MnpbEhh9jyipgxe19OcubqV5w
April 1, 2024
125098
Egypt, Arab Rep.
EGY
true
2
1
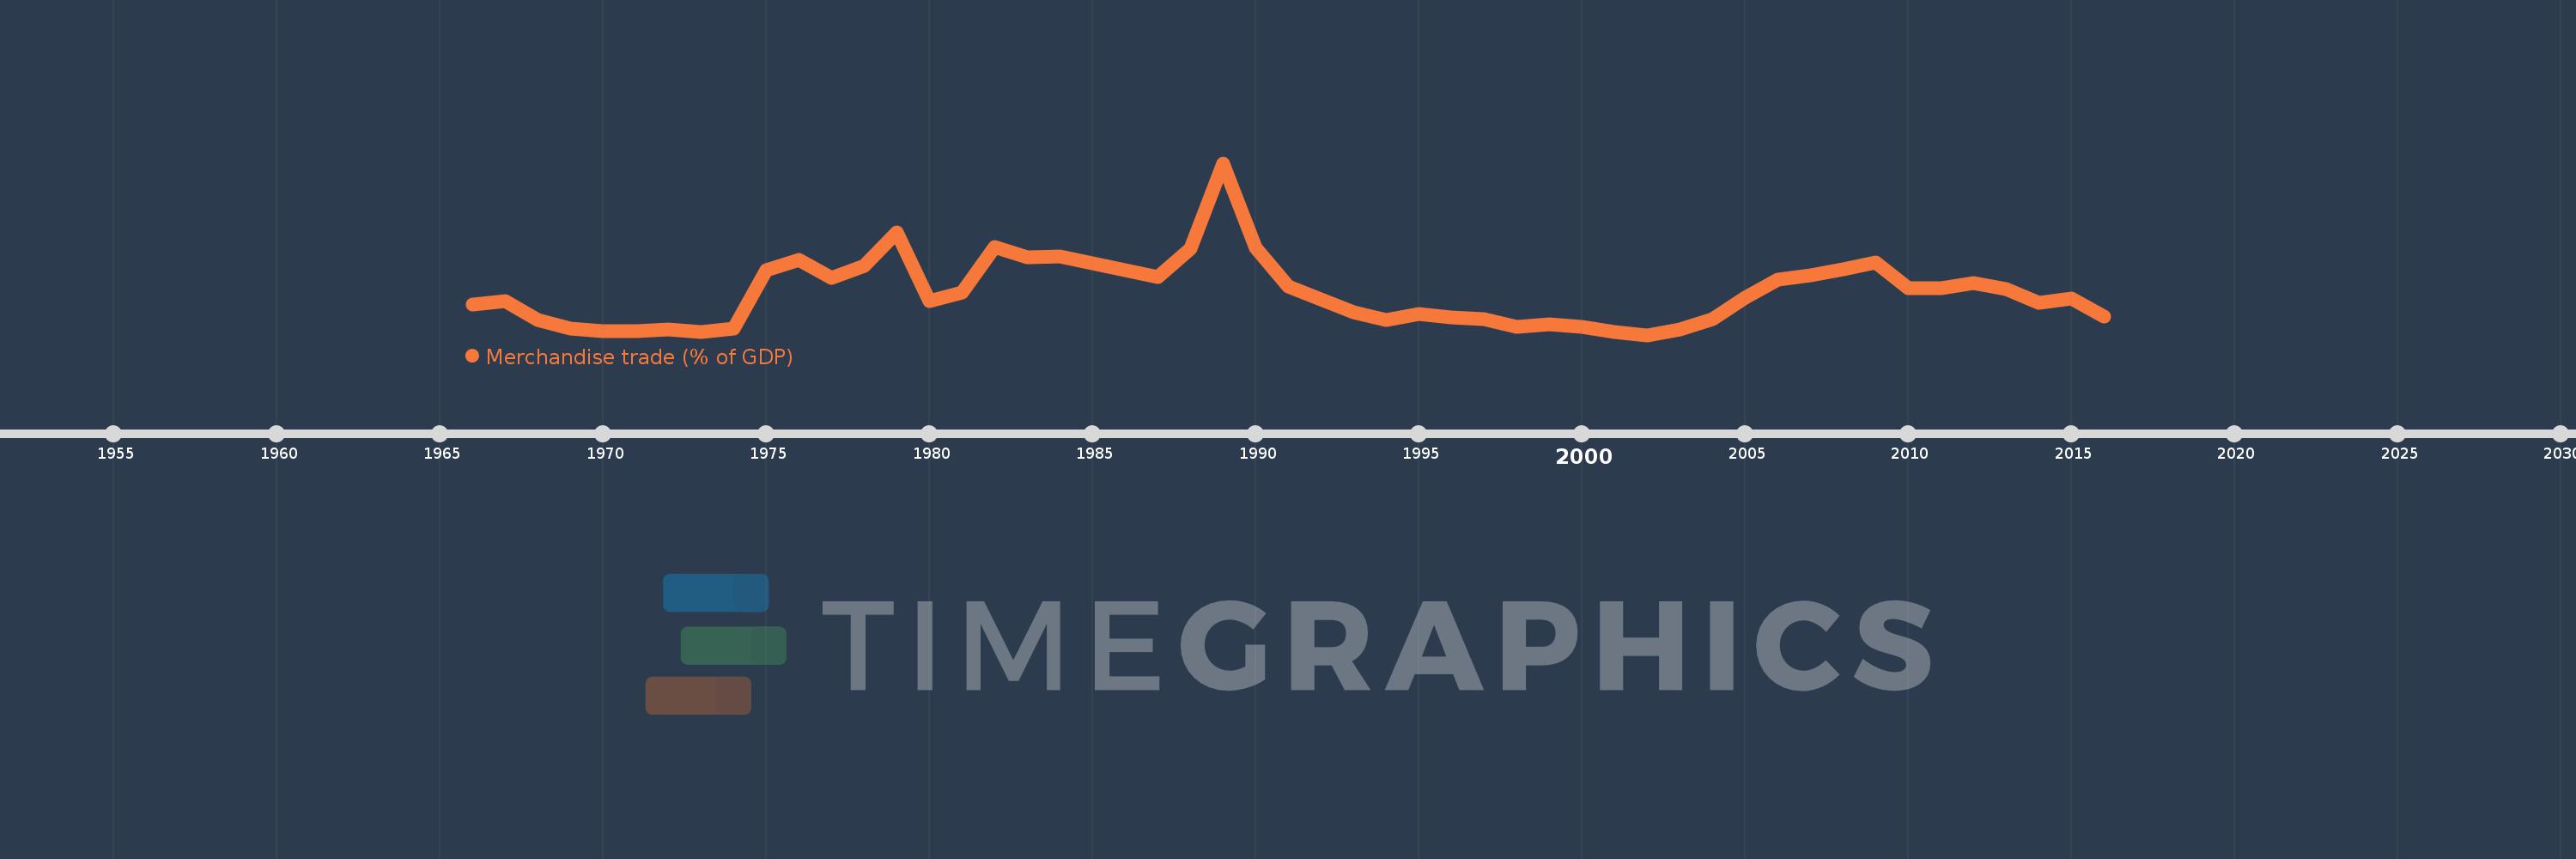
Merchandise trade (% of GDP)
2016,2015,2014,2013,2012,2011,2010,2009,2008,2007,2006,2005,2004,2003,2002,2001,2000,1999,1998,1997,1996,1995,1994,1993,1992,1991,1990,1989,1988,1987,1986,1985,1984,1983,1982,1981,1980,1979,1978,1977,1976,1975,1974,1973,1972,1971,1970,1969,1968,1967,1966
This statistics in other country:
AfghanistanAlbaniaAlgeriaAngolaAntigua and BarbudaArab WorldArgentinaArmeniaArubaAustraliaAustriaAzerbaijanBahamas, TheBahrainBangladeshBarbadosBelarusBelgiumBelizeBeninBermudaBhutanBoliviaBosnia and HerzegovinaBotswanaBrazilBrunei DarussalamBulgariaBurkina FasoBurundiCabo VerdeCambodiaCameroonCanadaCaribbean small statesCentral African RepublicCentral Europe and the BalticsChadChileChinaColombiaComorosCongo, Dem. Rep.Congo, Rep.Costa RicaCote d'IvoireCroatiaCubaCyprusCzech RepublicDenmarkDjiboutiDominicaDominican RepublicEarly-demographic dividendEast Asia & PacificEast Asia & Pacific (excluding high income)East Asia & Pacific (IDA & IBRD countries)EcuadorEgypt, Arab Rep.El SalvadorEquatorial GuineaEritreaEstoniaEthiopiaEuro areaEurope & Central AsiaEurope & Central Asia (excluding high income)Europe & Central Asia (IDA & IBRD countries)European UnionFaroe IslandsFijiFinlandFragile and conflict affected situationsFranceFrench PolynesiaGabonGambia, TheGeorgiaGermanyGhanaGreeceGreenlandGrenadaGuatemalaGuineaGuinea-BissauGuyanaHaitiHeavily indebted poor countries (HIPC)High incomeHondurasHong Kong SAR, ChinaHungaryIBRD onlyIcelandIDA & IBRD totalIDA blendIDA onlyIDA totalIndiaIndonesiaIran, Islamic Rep.IraqIrelandIsraelItalyJamaicaJapanJordanKazakhstanKenyaKiribatiKorea, Rep.KuwaitKyrgyz RepublicLao PDRLate-demographic dividendLatin America & Caribbean Latin America & Caribbean (excluding high income)Latin America & the Caribbean (IDA & IBRD countries)LatviaLeast developed countries: UN classificationLebanonLesothoLiberiaLibyaLithuaniaLow & middle incomeLow incomeLower middle incomeLuxembourgMacao SAR, ChinaMacedonia, FYRMadagascarMalawiMalaysiaMaldivesMaliMaltaMarshall IslandsMauritaniaMauritiusMexicoMicronesia, Fed. Sts.Middle East & North AfricaMiddle East & North Africa (excluding high income)Middle East & North Africa (IDA & IBRD countries)Middle incomeMoldovaMongoliaMontenegroMoroccoMozambiqueMyanmarNamibiaNepalNetherlandsNew CaledoniaNew ZealandNicaraguaNigerNigeriaNorth AmericaNorwayOECD membersOmanOther small statesPacific island small statesPakistanPalauPanamaPapua New GuineaParaguayPeruPhilippinesPolandPortugalPost-demographic dividendPre-demographic dividendQatarRomaniaRussian FederationRwandaSamoaSao Tome and PrincipeSaudi ArabiaSenegalSerbiaSeychellesSierra LeoneSingaporeSlovak RepublicSloveniaSmall statesSolomon IslandsSouth AfricaSouth AsiaSouth Asia (IDA & IBRD)SpainSri LankaSt. Kitts and NevisSt. LuciaSt. Vincent and the GrenadinesSub-Saharan Africa Sub-Saharan Africa (excluding high income)Sub-Saharan Africa (IDA & IBRD countries)SudanSurinameSwazilandSwedenSwitzerlandSyrian Arab RepublicTajikistanTanzaniaThailandTimor-LesteTogoTongaTrinidad and TobagoTunisiaTurkeyTurkmenistanTuvaluUgandaUkraineUnited Arab EmiratesUnited KingdomUnited StatesUpper middle incomeUruguayUzbekistanVanuatuVenezuela, RBVietnamWorldYemen, Rep.ZambiaZimbabwe Timeline:
This timeline shows a graph from 1966 to 2016 of Egypt, Arab Rep.. No data until 1965. Number of actual observations by date: 51.
Source name:
World Development Indicators
Source organization:
World Trade Organization, and World Bank GDP estimates.
Categories, topics:
Private Sector, Trade
Last updated:
apr 23, 2017
Indicators value changes by year
Minimum:
18.642
jan 1, 2002
Maximum:
82.763
jan 1, 1989
At the date of observation
Value
Absolute change
Change from previous value
jan 1, 1966
30.103
+30.103
0.0%
jan 1, 1967
31.386
+1.283
4.26%
jan 1, 1968
24.345
-7.041
-22.43%
jan 1, 1969
21.079
-3.266
-13.41%
jan 1, 1970
20.153
-0.926
-4.39%
jan 1, 1971
20.154
+0.001
0.01%
jan 1, 1972
20.676
+0.522
2.59%
jan 1, 1973
19.672
-1.004
-4.86%
jan 1, 1974
21.17
+1.499
7.62%
jan 1, 1975
42.901
+21.73
102.64%
jan 1, 1976
46.649
+3.748
8.74%
jan 1, 1977
39.886
-6.763
-14.5%
jan 1, 1978
44.574
+4.688
11.75%
jan 1, 1979
56.996
+12.422
27.87%
jan 1, 1980
31.278
-25.719
-45.12%
jan 1, 1981
34.505
+3.227
10.32%
jan 1, 1982
51.578
+17.073
49.48%
jan 1, 1983
47.663
-3.915
-7.59%
jan 1, 1984
47.943
+0.281
0.59%
jan 1, 1985
45.381
-2.562
-5.34%
jan 1, 1986
42.716
-2.665
-5.87%
jan 1, 1987
40.234
-2.482
-5.81%
jan 1, 1988
50.795
+10.561
26.25%
jan 1, 1989
82.763
+31.968
62.94%
jan 1, 1990
51.263
-31.5
-38.06%
jan 1, 1991
36.839
-14.424
-28.14%
jan 1, 1992
31.801
-5.038
-13.68%
jan 1, 1993
27.208
-4.593
-14.44%
jan 1, 1994
24.301
-2.907
-10.68%
jan 1, 1995
26.388
+2.087
8.59%
jan 1, 1996
25.283
-1.105
-4.19%
jan 1, 1997
24.511
-0.771
-3.05%
jan 1, 1998
21.842
-2.67
-10.89%
jan 1, 1999
22.747
+0.905
4.14%
jan 1, 2000
21.586
-1.161
-5.1%
jan 1, 2001
19.886
-1.7
-7.87%
jan 1, 2002
18.642
-1.245
-6.26%
jan 1, 2003
20.849
+2.207
11.84%
jan 1, 2004
24.55
+3.701
17.75%
jan 1, 2005
32.483
+7.933
32.32%
jan 1, 2006
39.428
+6.945
21.38%
jan 1, 2007
40.962
+1.535
3.89%
jan 1, 2008
43.167
+2.205
5.38%
jan 1, 2009
45.821
+2.654
6.15%
jan 1, 2010
35.986
-9.835
-21.46%
jan 1, 2011
36.256
+0.27
0.75%
jan 1, 2012
37.894
+1.638
4.52%
jan 1, 2013
35.682
-2.212
-5.84%
jan 1, 2014
30.822
-4.86
-13.62%
jan 1, 2015
32.388
+1.566
5.08%
jan 1, 2016
25.423
-6.964
-21.5%
Ranking of countries by current statistics by years


Comments: