29
/
en
AIzaSyAYiBZKx7MnpbEhh9jyipgxe19OcubqV5w
April 1, 2024
85297
Bermuda
BMU
true
2
1
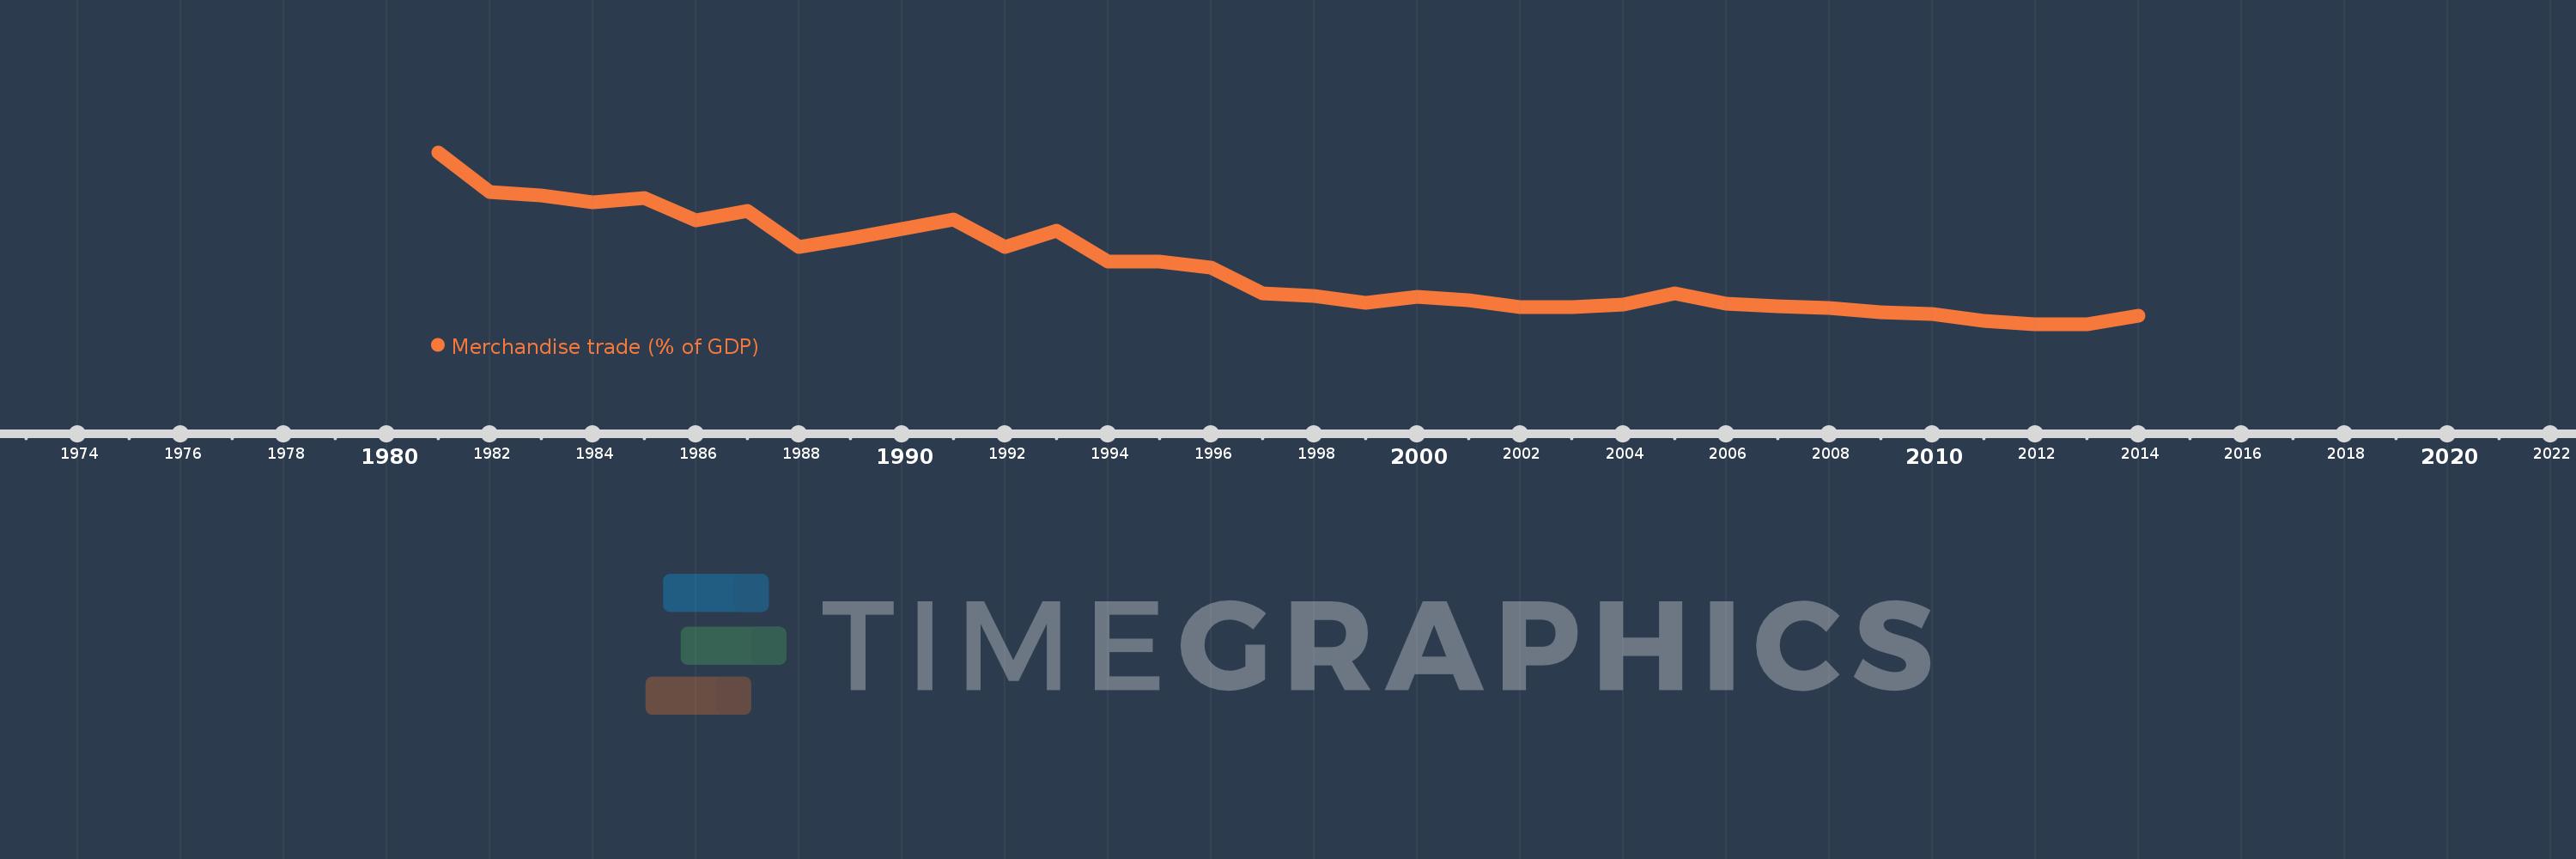
Merchandise trade (% of GDP)
2014,2013,2012,2011,2010,2009,2008,2007,2006,2005,2004,2003,2002,2001,2000,1999,1998,1997,1996,1995,1994,1993,1992,1991,1990,1989,1988,1987,1986,1985,1984,1983,1982,1981
This statistics in other country:
AfghanistanAlbaniaAlgeriaAngolaAntigua and BarbudaArab WorldArgentinaArmeniaArubaAustraliaAustriaAzerbaijanBahamas, TheBahrainBangladeshBarbadosBelarusBelgiumBelizeBeninBermudaBhutanBoliviaBosnia and HerzegovinaBotswanaBrazilBrunei DarussalamBulgariaBurkina FasoBurundiCabo VerdeCambodiaCameroonCanadaCaribbean small statesCentral African RepublicCentral Europe and the BalticsChadChileChinaColombiaComorosCongo, Dem. Rep.Congo, Rep.Costa RicaCote d'IvoireCroatiaCubaCyprusCzech RepublicDenmarkDjiboutiDominicaDominican RepublicEarly-demographic dividendEast Asia & PacificEast Asia & Pacific (excluding high income)East Asia & Pacific (IDA & IBRD countries)EcuadorEgypt, Arab Rep.El SalvadorEquatorial GuineaEritreaEstoniaEthiopiaEuro areaEurope & Central AsiaEurope & Central Asia (excluding high income)Europe & Central Asia (IDA & IBRD countries)European UnionFaroe IslandsFijiFinlandFragile and conflict affected situationsFranceFrench PolynesiaGabonGambia, TheGeorgiaGermanyGhanaGreeceGreenlandGrenadaGuatemalaGuineaGuinea-BissauGuyanaHaitiHeavily indebted poor countries (HIPC)High incomeHondurasHong Kong SAR, ChinaHungaryIBRD onlyIcelandIDA & IBRD totalIDA blendIDA onlyIDA totalIndiaIndonesiaIran, Islamic Rep.IraqIrelandIsraelItalyJamaicaJapanJordanKazakhstanKenyaKiribatiKorea, Rep.KuwaitKyrgyz RepublicLao PDRLate-demographic dividendLatin America & Caribbean Latin America & Caribbean (excluding high income)Latin America & the Caribbean (IDA & IBRD countries)LatviaLeast developed countries: UN classificationLebanonLesothoLiberiaLibyaLithuaniaLow & middle incomeLow incomeLower middle incomeLuxembourgMacao SAR, ChinaMacedonia, FYRMadagascarMalawiMalaysiaMaldivesMaliMaltaMarshall IslandsMauritaniaMauritiusMexicoMicronesia, Fed. Sts.Middle East & North AfricaMiddle East & North Africa (excluding high income)Middle East & North Africa (IDA & IBRD countries)Middle incomeMoldovaMongoliaMontenegroMoroccoMozambiqueMyanmarNamibiaNepalNetherlandsNew CaledoniaNew ZealandNicaraguaNigerNigeriaNorth AmericaNorwayOECD membersOmanOther small statesPacific island small statesPakistanPalauPanamaPapua New GuineaParaguayPeruPhilippinesPolandPortugalPost-demographic dividendPre-demographic dividendQatarRomaniaRussian FederationRwandaSamoaSao Tome and PrincipeSaudi ArabiaSenegalSerbiaSeychellesSierra LeoneSingaporeSlovak RepublicSloveniaSmall statesSolomon IslandsSouth AfricaSouth AsiaSouth Asia (IDA & IBRD)SpainSri LankaSt. Kitts and NevisSt. LuciaSt. Vincent and the GrenadinesSub-Saharan Africa Sub-Saharan Africa (excluding high income)Sub-Saharan Africa (IDA & IBRD countries)SudanSurinameSwazilandSwedenSwitzerlandSyrian Arab RepublicTajikistanTanzaniaThailandTimor-LesteTogoTongaTrinidad and TobagoTunisiaTurkeyTurkmenistanTuvaluUgandaUkraineUnited Arab EmiratesUnited KingdomUnited StatesUpper middle incomeUruguayUzbekistanVanuatuVenezuela, RBVietnamWorldYemen, Rep.ZambiaZimbabwe Timeline:
This timeline shows a graph from 1981 to 2014 of Bermuda. No data until 1980. Number of actual observations by date: 34.
Source name:
World Development Indicators
Source organization:
World Trade Organization, and World Bank GDP estimates.
Categories, topics:
Private Sector, Trade
Last updated:
apr 23, 2017
Indicators value changes by year
Minimum:
16.451
jan 1, 2013
Maximum:
56.905
jan 1, 1981
At the date of observation
Value
Absolute change
Change from previous value
jan 1, 1981
56.905
+56.905
0.0%
jan 1, 1982
47.625
-9.28
-16.31%
jan 1, 1983
46.849
-0.776
-1.63%
jan 1, 1984
45.087
-1.763
-3.76%
jan 1, 1985
46.16
+1.074
2.38%
jan 1, 1986
40.981
-5.179
-11.22%
jan 1, 1987
43.034
+2.052
5.01%
jan 1, 1988
34.632
-8.402
-19.52%
jan 1, 1989
36.676
+2.044
5.9%
jan 1, 1990
38.961
+2.285
6.23%
jan 1, 1991
41.133
+2.172
5.57%
jan 1, 1992
34.559
-6.574
-15.98%
jan 1, 1993
38.514
+3.956
11.45%
jan 1, 1994
31.258
-7.257
-18.84%
jan 1, 1995
31.224
-0.034
-0.11%
jan 1, 1996
29.841
-1.383
-4.43%
jan 1, 1997
23.633
-6.208
-20.8%
jan 1, 1998
23.049
-0.584
-2.47%
jan 1, 1999
21.528
-1.521
-6.6%
jan 1, 2000
22.951
+1.423
6.61%
jan 1, 2001
22.154
-0.798
-3.47%
jan 1, 2002
20.541
-1.613
-7.28%
jan 1, 2003
20.395
-0.146
-0.71%
jan 1, 2004
21.139
+0.744
3.65%
jan 1, 2005
23.658
+2.519
11.92%
jan 1, 2006
21.24
-2.418
-10.22%
jan 1, 2007
20.704
-0.536
-2.52%
jan 1, 2008
20.255
-0.45
-2.17%
jan 1, 2009
19.362
-0.893
-4.41%
jan 1, 2010
18.818
-0.543
-2.81%
jan 1, 2011
17.176
-1.642
-8.73%
jan 1, 2012
16.457
-0.719
-4.19%
jan 1, 2013
16.451
-0.006
-0.03%
jan 1, 2014
18.372
+1.921
11.67%
Ranking of countries by current statistics by years


Comments: