29
/
en
AIzaSyAYiBZKx7MnpbEhh9jyipgxe19OcubqV5w
April 1, 2024
42634
Latin America & Caribbean (excluding high income)
LAC
false
2
1
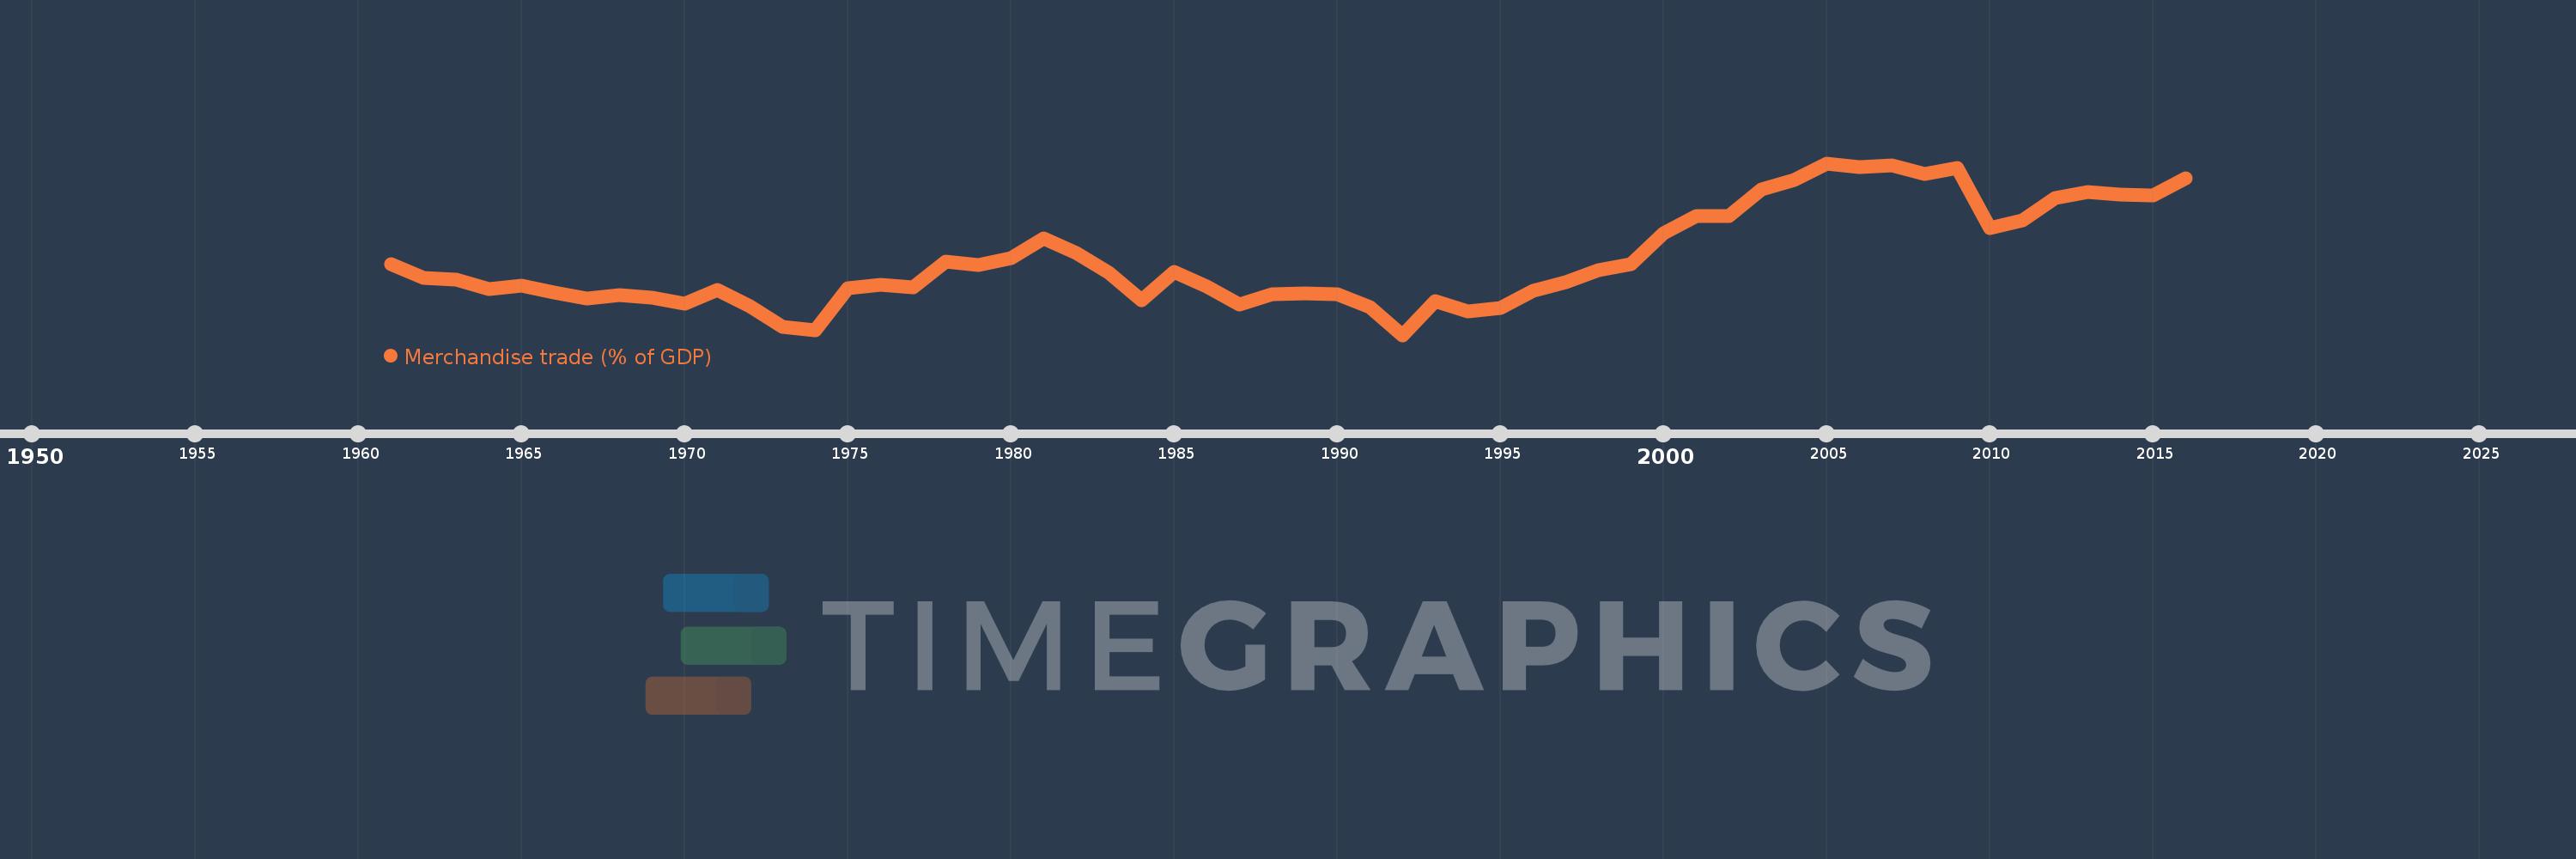
Merchandise trade (% of GDP)
2016,2015,2014,2013,2012,2011,2010,2009,2008,2007,2006,2005,2004,2003,2002,2001,2000,1999,1998,1997,1996,1995,1994,1993,1992,1991,1990,1989,1988,1987,1986,1985,1984,1983,1982,1981,1980,1979,1978,1977,1976,1975,1974,1973,1972,1971,1970,1969,1968,1967,1966,1965,1964,1963,1962,1961
This statistics in other country:
AfghanistanAlbaniaAlgeriaAngolaAntigua and BarbudaArab WorldArgentinaArmeniaArubaAustraliaAustriaAzerbaijanBahamas, TheBahrainBangladeshBarbadosBelarusBelgiumBelizeBeninBermudaBhutanBoliviaBosnia and HerzegovinaBotswanaBrazilBrunei DarussalamBulgariaBurkina FasoBurundiCabo VerdeCambodiaCameroonCanadaCaribbean small statesCentral African RepublicCentral Europe and the BalticsChadChileChinaColombiaComorosCongo, Dem. Rep.Congo, Rep.Costa RicaCote d'IvoireCroatiaCubaCyprusCzech RepublicDenmarkDjiboutiDominicaDominican RepublicEarly-demographic dividendEast Asia & PacificEast Asia & Pacific (excluding high income)East Asia & Pacific (IDA & IBRD countries)EcuadorEgypt, Arab Rep.El SalvadorEquatorial GuineaEritreaEstoniaEthiopiaEuro areaEurope & Central AsiaEurope & Central Asia (excluding high income)Europe & Central Asia (IDA & IBRD countries)European UnionFaroe IslandsFijiFinlandFragile and conflict affected situationsFranceFrench PolynesiaGabonGambia, TheGeorgiaGermanyGhanaGreeceGreenlandGrenadaGuatemalaGuineaGuinea-BissauGuyanaHaitiHeavily indebted poor countries (HIPC)High incomeHondurasHong Kong SAR, ChinaHungaryIBRD onlyIcelandIDA & IBRD totalIDA blendIDA onlyIDA totalIndiaIndonesiaIran, Islamic Rep.IraqIrelandIsraelItalyJamaicaJapanJordanKazakhstanKenyaKiribatiKorea, Rep.KuwaitKyrgyz RepublicLao PDRLate-demographic dividendLatin America & Caribbean Latin America & Caribbean (excluding high income)Latin America & the Caribbean (IDA & IBRD countries)LatviaLeast developed countries: UN classificationLebanonLesothoLiberiaLibyaLithuaniaLow & middle incomeLow incomeLower middle incomeLuxembourgMacao SAR, ChinaMacedonia, FYRMadagascarMalawiMalaysiaMaldivesMaliMaltaMarshall IslandsMauritaniaMauritiusMexicoMicronesia, Fed. Sts.Middle East & North AfricaMiddle East & North Africa (excluding high income)Middle East & North Africa (IDA & IBRD countries)Middle incomeMoldovaMongoliaMontenegroMoroccoMozambiqueMyanmarNamibiaNepalNetherlandsNew CaledoniaNew ZealandNicaraguaNigerNigeriaNorth AmericaNorwayOECD membersOmanOther small statesPacific island small statesPakistanPalauPanamaPapua New GuineaParaguayPeruPhilippinesPolandPortugalPost-demographic dividendPre-demographic dividendQatarRomaniaRussian FederationRwandaSamoaSao Tome and PrincipeSaudi ArabiaSenegalSerbiaSeychellesSierra LeoneSingaporeSlovak RepublicSloveniaSmall statesSolomon IslandsSouth AfricaSouth AsiaSouth Asia (IDA & IBRD)SpainSri LankaSt. Kitts and NevisSt. LuciaSt. Vincent and the GrenadinesSub-Saharan Africa Sub-Saharan Africa (excluding high income)Sub-Saharan Africa (IDA & IBRD countries)SudanSurinameSwazilandSwedenSwitzerlandSyrian Arab RepublicTajikistanTanzaniaThailandTimor-LesteTogoTongaTrinidad and TobagoTunisiaTurkeyTurkmenistanTuvaluUgandaUkraineUnited Arab EmiratesUnited KingdomUnited StatesUpper middle incomeUruguayUzbekistanVanuatuVenezuela, RBVietnamWorldYemen, Rep.ZambiaZimbabwe Timeline:
This timeline shows a graph from 1961 to 2016 of Latin America & Caribbean (excluding high income). No data until 1960. Number of actual observations by date: 56.
Source name:
World Development Indicators
Source organization:
World Trade Organization, and World Bank GDP estimates.
Categories, topics:
Private Sector, Trade
Last updated:
apr 23, 2017
Indicators value changes by year
Minimum:
18.915
jan 1, 1992
Maximum:
39.536
jan 1, 2005
At the date of observation
Value
Absolute change
Change from previous value
jan 1, 1961
27.422
+27.422
0.0%
jan 1, 1962
25.817
-1.605
-5.85%
jan 1, 1963
25.524
-0.294
-1.14%
jan 1, 1964
24.385
-1.139
-4.46%
jan 1, 1965
24.843
+0.458
1.88%
jan 1, 1966
24.003
-0.84
-3.38%
jan 1, 1967
23.335
-0.668
-2.78%
jan 1, 1968
23.72
+0.385
1.65%
jan 1, 1969
23.355
-0.365
-1.54%
jan 1, 1970
22.689
-0.666
-2.85%
jan 1, 1971
24.292
+1.603
7.06%
jan 1, 1972
22.329
-1.963
-8.08%
jan 1, 1973
19.893
-2.436
-10.91%
jan 1, 1974
19.453
-0.439
-2.21%
jan 1, 1975
24.526
+5.073
26.08%
jan 1, 1976
24.923
+0.397
1.62%
jan 1, 1977
24.687
-0.236
-0.95%
jan 1, 1978
27.705
+3.018
12.23%
jan 1, 1979
27.273
-0.432
-1.56%
jan 1, 1980
28.155
+0.881
3.23%
jan 1, 1981
30.536
+2.382
8.46%
jan 1, 1982
28.714
-1.822
-5.97%
jan 1, 1983
26.414
-2.301
-8.01%
jan 1, 1984
23.052
-3.362
-12.73%
jan 1, 1985
26.463
+3.411
14.79%
jan 1, 1986
24.779
-1.684
-6.36%
jan 1, 1987
22.551
-2.228
-8.99%
jan 1, 1988
23.783
+1.232
5.46%
jan 1, 1989
23.934
+0.151
0.63%
jan 1, 1990
23.813
-0.121
-0.51%
jan 1, 1991
22.23
-1.583
-6.65%
jan 1, 1992
18.915
-3.315
-14.91%
jan 1, 1993
23.022
+4.107
21.71%
jan 1, 1994
21.711
-1.311
-5.69%
jan 1, 1995
22.17
+0.459
2.12%
jan 1, 1996
24.245
+2.075
9.36%
jan 1, 1997
25.253
+1.008
4.16%
jan 1, 1998
26.71
+1.457
5.77%
jan 1, 1999
27.408
+0.698
2.61%
jan 1, 2000
31.15
+3.742
13.65%
jan 1, 2001
33.233
+2.083
6.69%
jan 1, 2002
33.213
-0.02
-0.06%
jan 1, 2003
36.433
+3.22
9.7%
jan 1, 2004
37.515
+1.081
2.97%
jan 1, 2005
39.536
+2.021
5.39%
jan 1, 2006
39.069
-0.467
-1.18%
jan 1, 2007
39.284
+0.215
0.55%
jan 1, 2008
38.246
-1.038
-2.64%
jan 1, 2009
38.938
+0.691
1.81%
jan 1, 2010
31.782
-7.156
-18.38%
jan 1, 2011
32.706
+0.925
2.91%
jan 1, 2012
35.405
+2.699
8.25%
jan 1, 2013
36.055
+0.65
1.84%
jan 1, 2014
35.746
-0.309
-0.86%
jan 1, 2015
35.692
-0.054
-0.15%
jan 1, 2016
37.705
+2.012
5.64%
Ranking of countries by current statistics by years


Comments: