29
/
en
AIzaSyAYiBZKx7MnpbEhh9jyipgxe19OcubqV5w
April 1, 2024
30077
Euro area
EMU
false
2
1
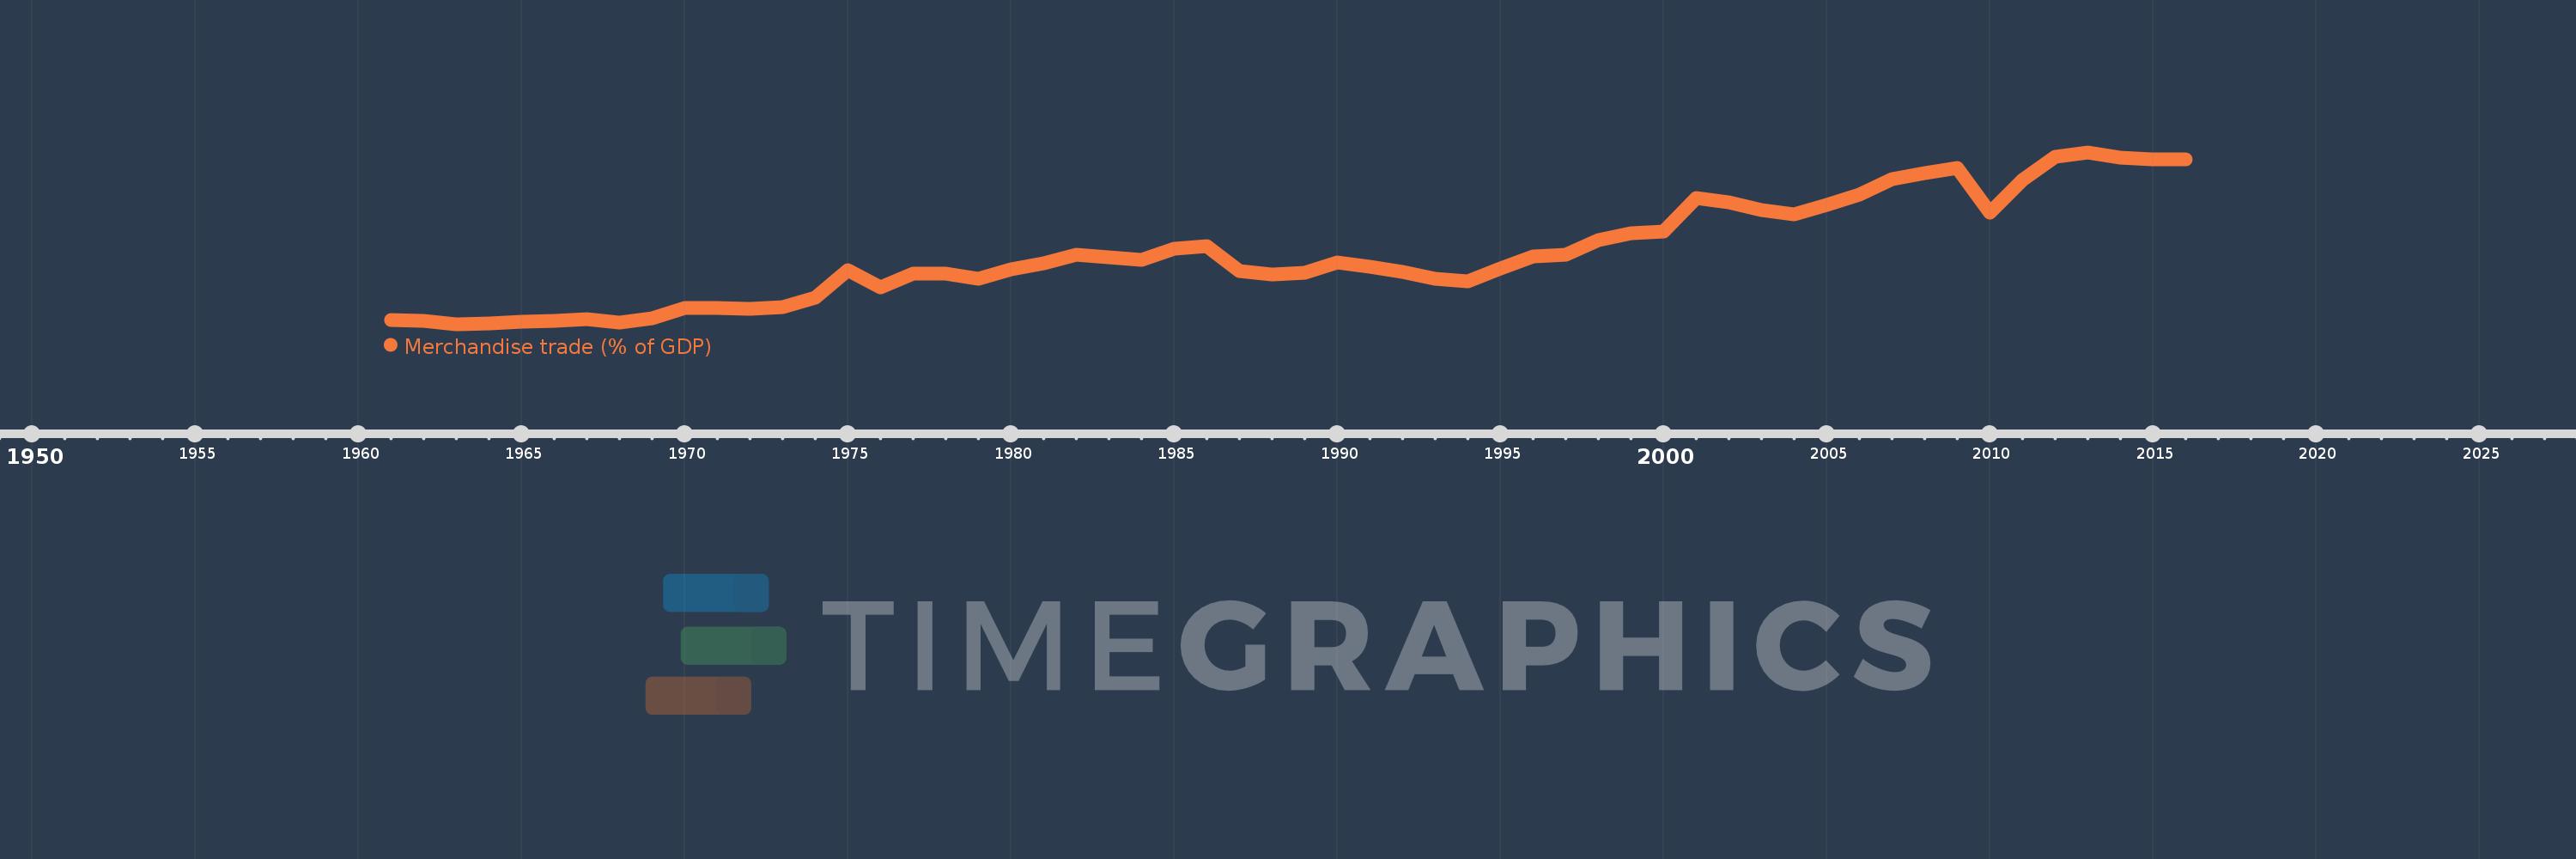
Merchandise trade (% of GDP)
2016,2015,2014,2013,2012,2011,2010,2009,2008,2007,2006,2005,2004,2003,2002,2001,2000,1999,1998,1997,1996,1995,1994,1993,1992,1991,1990,1989,1988,1987,1986,1985,1984,1983,1982,1981,1980,1979,1978,1977,1976,1975,1974,1973,1972,1971,1970,1969,1968,1967,1966,1965,1964,1963,1962,1961
This statistics in other country:
AfghanistanAlbaniaAlgeriaAngolaAntigua and BarbudaArab WorldArgentinaArmeniaArubaAustraliaAustriaAzerbaijanBahamas, TheBahrainBangladeshBarbadosBelarusBelgiumBelizeBeninBermudaBhutanBoliviaBosnia and HerzegovinaBotswanaBrazilBrunei DarussalamBulgariaBurkina FasoBurundiCabo VerdeCambodiaCameroonCanadaCaribbean small statesCentral African RepublicCentral Europe and the BalticsChadChileChinaColombiaComorosCongo, Dem. Rep.Congo, Rep.Costa RicaCote d'IvoireCroatiaCubaCyprusCzech RepublicDenmarkDjiboutiDominicaDominican RepublicEarly-demographic dividendEast Asia & PacificEast Asia & Pacific (excluding high income)East Asia & Pacific (IDA & IBRD countries)EcuadorEgypt, Arab Rep.El SalvadorEquatorial GuineaEritreaEstoniaEthiopiaEuro areaEurope & Central AsiaEurope & Central Asia (excluding high income)Europe & Central Asia (IDA & IBRD countries)European UnionFaroe IslandsFijiFinlandFragile and conflict affected situationsFranceFrench PolynesiaGabonGambia, TheGeorgiaGermanyGhanaGreeceGreenlandGrenadaGuatemalaGuineaGuinea-BissauGuyanaHaitiHeavily indebted poor countries (HIPC)High incomeHondurasHong Kong SAR, ChinaHungaryIBRD onlyIcelandIDA & IBRD totalIDA blendIDA onlyIDA totalIndiaIndonesiaIran, Islamic Rep.IraqIrelandIsraelItalyJamaicaJapanJordanKazakhstanKenyaKiribatiKorea, Rep.KuwaitKyrgyz RepublicLao PDRLate-demographic dividendLatin America & Caribbean Latin America & Caribbean (excluding high income)Latin America & the Caribbean (IDA & IBRD countries)LatviaLeast developed countries: UN classificationLebanonLesothoLiberiaLibyaLithuaniaLow & middle incomeLow incomeLower middle incomeLuxembourgMacao SAR, ChinaMacedonia, FYRMadagascarMalawiMalaysiaMaldivesMaliMaltaMarshall IslandsMauritaniaMauritiusMexicoMicronesia, Fed. Sts.Middle East & North AfricaMiddle East & North Africa (excluding high income)Middle East & North Africa (IDA & IBRD countries)Middle incomeMoldovaMongoliaMontenegroMoroccoMozambiqueMyanmarNamibiaNepalNetherlandsNew CaledoniaNew ZealandNicaraguaNigerNigeriaNorth AmericaNorwayOECD membersOmanOther small statesPacific island small statesPakistanPalauPanamaPapua New GuineaParaguayPeruPhilippinesPolandPortugalPost-demographic dividendPre-demographic dividendQatarRomaniaRussian FederationRwandaSamoaSao Tome and PrincipeSaudi ArabiaSenegalSerbiaSeychellesSierra LeoneSingaporeSlovak RepublicSloveniaSmall statesSolomon IslandsSouth AfricaSouth AsiaSouth Asia (IDA & IBRD)SpainSri LankaSt. Kitts and NevisSt. LuciaSt. Vincent and the GrenadinesSub-Saharan Africa Sub-Saharan Africa (excluding high income)Sub-Saharan Africa (IDA & IBRD countries)SudanSurinameSwazilandSwedenSwitzerlandSyrian Arab RepublicTajikistanTanzaniaThailandTimor-LesteTogoTongaTrinidad and TobagoTunisiaTurkeyTurkmenistanTuvaluUgandaUkraineUnited Arab EmiratesUnited KingdomUnited StatesUpper middle incomeUruguayUzbekistanVanuatuVenezuela, RBVietnamWorldYemen, Rep.ZambiaZimbabwe Timeline:
This timeline shows a graph from 1961 to 2016 of Euro area. No data until 1960. Number of actual observations by date: 56.
Source name:
World Development Indicators
Source organization:
World Trade Organization, and World Bank GDP estimates.
Categories, topics:
Private Sector, Trade
Last updated:
apr 23, 2017
Indicators value changes by year
Minimum:
28.921
jan 1, 1963
Maximum:
70.153
jan 1, 2013
At the date of observation
Value
Absolute change
Change from previous value
jan 1, 1961
30.003
+30.003
0.0%
jan 1, 1962
29.64
-0.363
-1.21%
jan 1, 1963
28.921
-0.719
-2.43%
jan 1, 1964
29.091
+0.17
0.59%
jan 1, 1965
29.567
+0.476
1.64%
jan 1, 1966
29.822
+0.255
0.86%
jan 1, 1967
30.169
+0.347
1.16%
jan 1, 1968
29.229
-0.941
-3.12%
jan 1, 1969
30.323
+1.094
3.74%
jan 1, 1970
32.859
+2.536
8.36%
jan 1, 1971
32.782
-0.076
-0.23%
jan 1, 1972
32.659
-0.123
-0.38%
jan 1, 1973
32.939
+0.281
0.86%
jan 1, 1974
35.261
+2.322
7.05%
jan 1, 1975
41.848
+6.587
18.68%
jan 1, 1976
37.808
-4.041
-9.66%
jan 1, 1977
41.145
+3.337
8.83%
jan 1, 1978
41.132
-0.013
-0.03%
jan 1, 1979
39.876
-1.256
-3.05%
jan 1, 1980
42.183
+2.307
5.79%
jan 1, 1981
43.633
+1.45
3.44%
jan 1, 1982
45.516
+1.882
4.31%
jan 1, 1983
44.965
-0.551
-1.21%
jan 1, 1984
44.326
-0.638
-1.42%
jan 1, 1985
47.047
+2.721
6.14%
jan 1, 1986
47.715
+0.668
1.42%
jan 1, 1987
41.588
-6.128
-12.84%
jan 1, 1988
40.892
-0.696
-1.67%
jan 1, 1989
41.331
+0.439
1.07%
jan 1, 1990
43.75
+2.419
5.85%
jan 1, 1991
42.704
-1.046
-2.39%
jan 1, 1992
41.471
-1.234
-2.89%
jan 1, 1993
39.867
-1.604
-3.87%
jan 1, 1994
39.274
-0.592
-1.49%
jan 1, 1995
42.279
+3.005
7.65%
jan 1, 1996
45.112
+2.833
6.7%
jan 1, 1997
45.643
+0.531
1.18%
jan 1, 1998
49.054
+3.411
7.47%
jan 1, 1999
50.682
+1.628
3.32%
jan 1, 2000
51.243
+0.562
1.11%
jan 1, 2001
59.185
+7.942
15.5%
jan 1, 2002
58.196
-0.989
-1.67%
jan 1, 2003
56.273
-1.923
-3.3%
jan 1, 2004
55.209
-1.064
-1.89%
jan 1, 2005
57.456
+2.247
4.07%
jan 1, 2006
60.071
+2.615
4.55%
jan 1, 2007
63.748
+3.677
6.12%
jan 1, 2008
65.148
+1.4
2.2%
jan 1, 2009
66.363
+1.215
1.86%
jan 1, 2010
55.689
-10.674
-16.08%
jan 1, 2011
63.627
+7.938
14.25%
jan 1, 2012
69.065
+5.438
8.55%
jan 1, 2013
70.153
+1.088
1.58%
jan 1, 2014
68.87
-1.283
-1.83%
jan 1, 2015
68.529
-0.341
-0.49%
jan 1, 2016
68.575
+0.046
0.07%
Ranking of countries by current statistics by years


Comments: