29
/
en
AIzaSyAYiBZKx7MnpbEhh9jyipgxe19OcubqV5w
April 1, 2024
213256
Nigeria
NGA
true
2
1
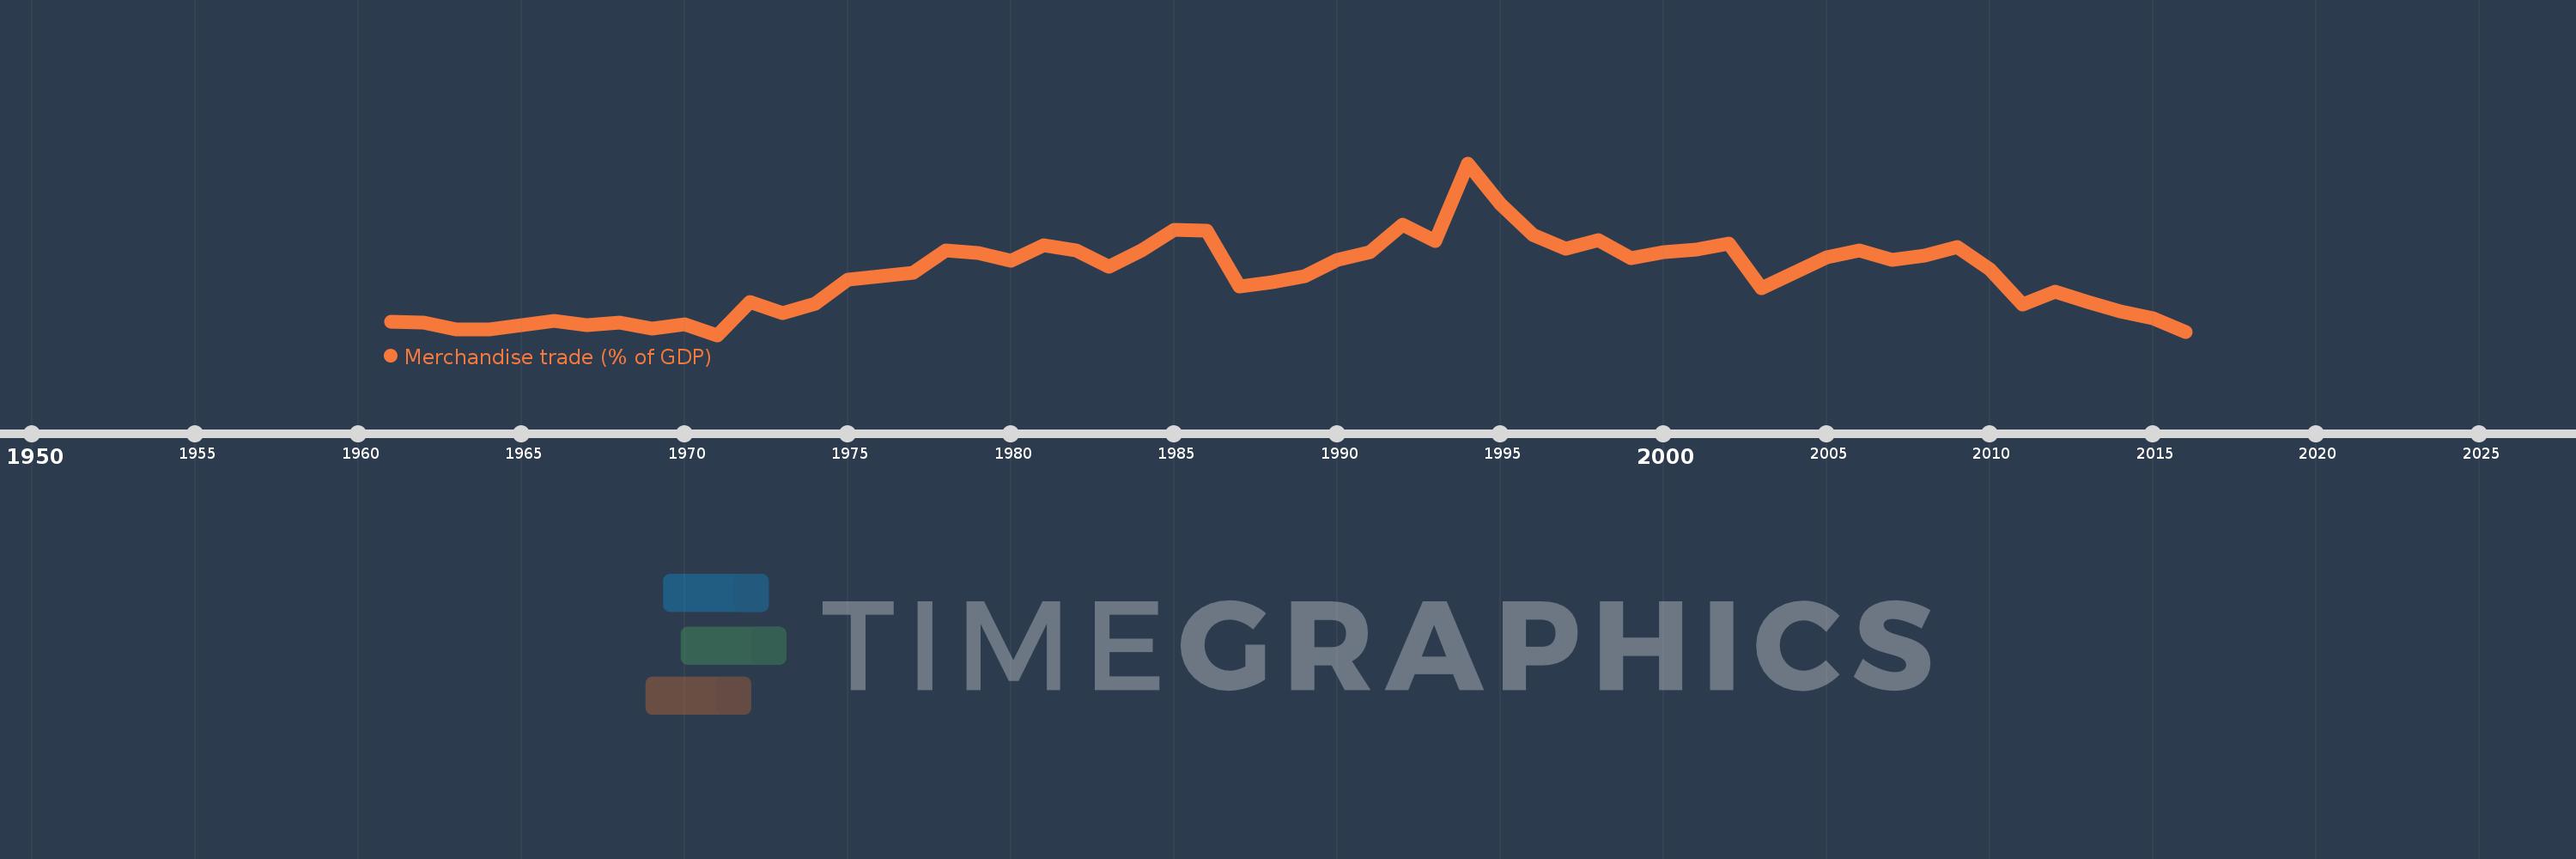
Merchandise trade (% of GDP)
2016,2015,2014,2013,2012,2011,2010,2009,2008,2007,2006,2005,2004,2003,2002,2001,2000,1999,1998,1997,1996,1995,1994,1993,1992,1991,1990,1989,1988,1987,1986,1985,1984,1983,1982,1981,1980,1979,1978,1977,1976,1975,1974,1973,1972,1971,1970,1969,1968,1967,1966,1965,1964,1963,1962,1961
This statistics in other country:
AfghanistanAlbaniaAlgeriaAngolaAntigua and BarbudaArab WorldArgentinaArmeniaArubaAustraliaAustriaAzerbaijanBahamas, TheBahrainBangladeshBarbadosBelarusBelgiumBelizeBeninBermudaBhutanBoliviaBosnia and HerzegovinaBotswanaBrazilBrunei DarussalamBulgariaBurkina FasoBurundiCabo VerdeCambodiaCameroonCanadaCaribbean small statesCentral African RepublicCentral Europe and the BalticsChadChileChinaColombiaComorosCongo, Dem. Rep.Congo, Rep.Costa RicaCote d'IvoireCroatiaCubaCyprusCzech RepublicDenmarkDjiboutiDominicaDominican RepublicEarly-demographic dividendEast Asia & PacificEast Asia & Pacific (excluding high income)East Asia & Pacific (IDA & IBRD countries)EcuadorEgypt, Arab Rep.El SalvadorEquatorial GuineaEritreaEstoniaEthiopiaEuro areaEurope & Central AsiaEurope & Central Asia (excluding high income)Europe & Central Asia (IDA & IBRD countries)European UnionFaroe IslandsFijiFinlandFragile and conflict affected situationsFranceFrench PolynesiaGabonGambia, TheGeorgiaGermanyGhanaGreeceGreenlandGrenadaGuatemalaGuineaGuinea-BissauGuyanaHaitiHeavily indebted poor countries (HIPC)High incomeHondurasHong Kong SAR, ChinaHungaryIBRD onlyIcelandIDA & IBRD totalIDA blendIDA onlyIDA totalIndiaIndonesiaIran, Islamic Rep.IraqIrelandIsraelItalyJamaicaJapanJordanKazakhstanKenyaKiribatiKorea, Rep.KuwaitKyrgyz RepublicLao PDRLate-demographic dividendLatin America & Caribbean Latin America & Caribbean (excluding high income)Latin America & the Caribbean (IDA & IBRD countries)LatviaLeast developed countries: UN classificationLebanonLesothoLiberiaLibyaLithuaniaLow & middle incomeLow incomeLower middle incomeLuxembourgMacao SAR, ChinaMacedonia, FYRMadagascarMalawiMalaysiaMaldivesMaliMaltaMarshall IslandsMauritaniaMauritiusMexicoMicronesia, Fed. Sts.Middle East & North AfricaMiddle East & North Africa (excluding high income)Middle East & North Africa (IDA & IBRD countries)Middle incomeMoldovaMongoliaMontenegroMoroccoMozambiqueMyanmarNamibiaNepalNetherlandsNew CaledoniaNew ZealandNicaraguaNigerNigeriaNorth AmericaNorwayOECD membersOmanOther small statesPacific island small statesPakistanPalauPanamaPapua New GuineaParaguayPeruPhilippinesPolandPortugalPost-demographic dividendPre-demographic dividendQatarRomaniaRussian FederationRwandaSamoaSao Tome and PrincipeSaudi ArabiaSenegalSerbiaSeychellesSierra LeoneSingaporeSlovak RepublicSloveniaSmall statesSolomon IslandsSouth AfricaSouth AsiaSouth Asia (IDA & IBRD)SpainSri LankaSt. Kitts and NevisSt. LuciaSt. Vincent and the GrenadinesSub-Saharan Africa Sub-Saharan Africa (excluding high income)Sub-Saharan Africa (IDA & IBRD countries)SudanSurinameSwazilandSwedenSwitzerlandSyrian Arab RepublicTajikistanTanzaniaThailandTimor-LesteTogoTongaTrinidad and TobagoTunisiaTurkeyTurkmenistanTuvaluUgandaUkraineUnited Arab EmiratesUnited KingdomUnited StatesUpper middle incomeUruguayUzbekistanVanuatuVenezuela, RBVietnamWorldYemen, Rep.ZambiaZimbabwe Timeline:
This timeline shows a graph from 1961 to 2016 of Nigeria. No data until 1960. Number of actual observations by date: 56.
Source name:
World Development Indicators
Source organization:
World Trade Organization, and World Bank GDP estimates.
Categories, topics:
Private Sector, Trade
Last updated:
apr 23, 2017
Indicators value changes by year
Minimum:
18.324
jan 1, 1971
Maximum:
110.305
jan 1, 1994
At the date of observation
Value
Absolute change
Change from previous value
jan 1, 1961
25.413
+25.413
0.0%
jan 1, 1962
24.814
-0.599
-2.36%
jan 1, 1963
21.117
-3.698
-14.9%
jan 1, 1964
21.286
+0.17
0.8%
jan 1, 1965
23.624
+2.337
10.98%
jan 1, 1966
25.858
+2.234
9.46%
jan 1, 1967
23.77
-2.088
-8.07%
jan 1, 1968
25.04
+1.269
5.34%
jan 1, 1969
21.739
-3.3
-13.18%
jan 1, 1970
23.926
+2.187
10.06%
jan 1, 1971
18.324
-5.602
-23.41%
jan 1, 1972
36.251
+17.926
97.83%
jan 1, 1973
30.02
-6.231
-17.19%
jan 1, 1974
35.111
+5.091
16.96%
jan 1, 1975
48.202
+13.091
37.29%
jan 1, 1976
49.95
+1.748
3.63%
jan 1, 1977
51.721
+1.771
3.55%
jan 1, 1978
63.642
+11.921
23.05%
jan 1, 1979
62.306
-1.336
-2.1%
jan 1, 1980
58.3
-4.006
-6.43%
jan 1, 1981
66.397
+8.097
13.89%
jan 1, 1982
63.399
-2.998
-4.51%
jan 1, 1983
54.956
-8.443
-13.32%
jan 1, 1984
63.78
+8.824
16.06%
jan 1, 1985
74.454
+10.674
16.74%
jan 1, 1986
74.202
-0.252
-0.34%
jan 1, 1987
44.345
-29.857
-40.24%
jan 1, 1988
46.806
+2.46
5.55%
jan 1, 1989
49.811
+3.005
6.42%
jan 1, 1990
58.549
+8.738
17.54%
jan 1, 1991
62.499
+3.951
6.75%
jan 1, 1992
77.575
+15.075
24.12%
jan 1, 1993
68.807
-8.768
-11.3%
jan 1, 1994
110.305
+41.498
60.31%
jan 1, 1995
88.619
-21.686
-19.66%
jan 1, 1996
72.036
-16.583
-18.71%
jan 1, 1997
64.568
-7.468
-10.37%
jan 1, 1998
68.974
+4.406
6.82%
jan 1, 1999
59.573
-9.401
-13.63%
jan 1, 2000
62.569
+2.996
5.03%
jan 1, 2001
64.019
+1.45
2.32%
jan 1, 2002
67.133
+3.113
4.86%
jan 1, 2003
43.172
-23.96
-35.69%
jan 1, 2004
51.561
+8.389
19.43%
jan 1, 2005
60.1
+8.539
16.56%
jan 1, 2006
63.449
+3.35
5.57%
jan 1, 2007
58.618
-4.831
-7.61%
jan 1, 2008
60.941
+2.322
3.96%
jan 1, 2009
65.472
+4.531
7.44%
jan 1, 2010
53.486
-11.986
-18.31%
jan 1, 2011
34.746
-18.739
-35.04%
jan 1, 2012
41.774
+7.027
20.22%
jan 1, 2013
35.947
-5.826
-13.95%
jan 1, 2014
30.759
-5.188
-14.43%
jan 1, 2015
27.124
-3.635
-11.82%
jan 1, 2016
20.039
-7.085
-26.12%
Ranking of countries by current statistics by years


Comments: