29
/
en
AIzaSyAYiBZKx7MnpbEhh9jyipgxe19OcubqV5w
April 1, 2024
194531
Mauritius
MUS
true
2
1
Merchandise trade (% of GDP)
2016,2015,2014,2013,2012,2011,2010,2009,2008,2007,2006,2005,2004,2003,2002,2001,2000,1999,1998,1997,1996,1995,1994,1993,1992,1991,1990,1989,1988,1987,1986,1985,1984,1983,1982,1981,1980,1979,1978,1977
This statistics in other country:
AfghanistanAlbaniaAlgeriaAngolaAntigua and BarbudaArab WorldArgentinaArmeniaArubaAustraliaAustriaAzerbaijanBahamas, TheBahrainBangladeshBarbadosBelarusBelgiumBelizeBeninBermudaBhutanBoliviaBosnia and HerzegovinaBotswanaBrazilBrunei DarussalamBulgariaBurkina FasoBurundiCabo VerdeCambodiaCameroonCanadaCaribbean small statesCentral African RepublicCentral Europe and the BalticsChadChileChinaColombiaComorosCongo, Dem. Rep.Congo, Rep.Costa RicaCote d'IvoireCroatiaCubaCyprusCzech RepublicDenmarkDjiboutiDominicaDominican RepublicEarly-demographic dividendEast Asia & PacificEast Asia & Pacific (excluding high income)East Asia & Pacific (IDA & IBRD countries)EcuadorEgypt, Arab Rep.El SalvadorEquatorial GuineaEritreaEstoniaEthiopiaEuro areaEurope & Central AsiaEurope & Central Asia (excluding high income)Europe & Central Asia (IDA & IBRD countries)European UnionFaroe IslandsFijiFinlandFragile and conflict affected situationsFranceFrench PolynesiaGabonGambia, TheGeorgiaGermanyGhanaGreeceGreenlandGrenadaGuatemalaGuineaGuinea-BissauGuyanaHaitiHeavily indebted poor countries (HIPC)High incomeHondurasHong Kong SAR, ChinaHungaryIBRD onlyIcelandIDA & IBRD totalIDA blendIDA onlyIDA totalIndiaIndonesiaIran, Islamic Rep.IraqIrelandIsraelItalyJamaicaJapanJordanKazakhstanKenyaKiribatiKorea, Rep.KuwaitKyrgyz RepublicLao PDRLate-demographic dividendLatin America & Caribbean Latin America & Caribbean (excluding high income)Latin America & the Caribbean (IDA & IBRD countries)LatviaLeast developed countries: UN classificationLebanonLesothoLiberiaLibyaLithuaniaLow & middle incomeLow incomeLower middle incomeLuxembourgMacao SAR, ChinaMacedonia, FYRMadagascarMalawiMalaysiaMaldivesMaliMaltaMarshall IslandsMauritaniaMauritiusMexicoMicronesia, Fed. Sts.Middle East & North AfricaMiddle East & North Africa (excluding high income)Middle East & North Africa (IDA & IBRD countries)Middle incomeMoldovaMongoliaMontenegroMoroccoMozambiqueMyanmarNamibiaNepalNetherlandsNew CaledoniaNew ZealandNicaraguaNigerNigeriaNorth AmericaNorwayOECD membersOmanOther small statesPacific island small statesPakistanPalauPanamaPapua New GuineaParaguayPeruPhilippinesPolandPortugalPost-demographic dividendPre-demographic dividendQatarRomaniaRussian FederationRwandaSamoaSao Tome and PrincipeSaudi ArabiaSenegalSerbiaSeychellesSierra LeoneSingaporeSlovak RepublicSloveniaSmall statesSolomon IslandsSouth AfricaSouth AsiaSouth Asia (IDA & IBRD)SpainSri LankaSt. Kitts and NevisSt. LuciaSt. Vincent and the GrenadinesSub-Saharan Africa Sub-Saharan Africa (excluding high income)Sub-Saharan Africa (IDA & IBRD countries)SudanSurinameSwazilandSwedenSwitzerlandSyrian Arab RepublicTajikistanTanzaniaThailandTimor-LesteTogoTongaTrinidad and TobagoTunisiaTurkeyTurkmenistanTuvaluUgandaUkraineUnited Arab EmiratesUnited KingdomUnited StatesUpper middle incomeUruguayUzbekistanVanuatuVenezuela, RBVietnamWorldYemen, Rep.ZambiaZimbabwe Timeline:
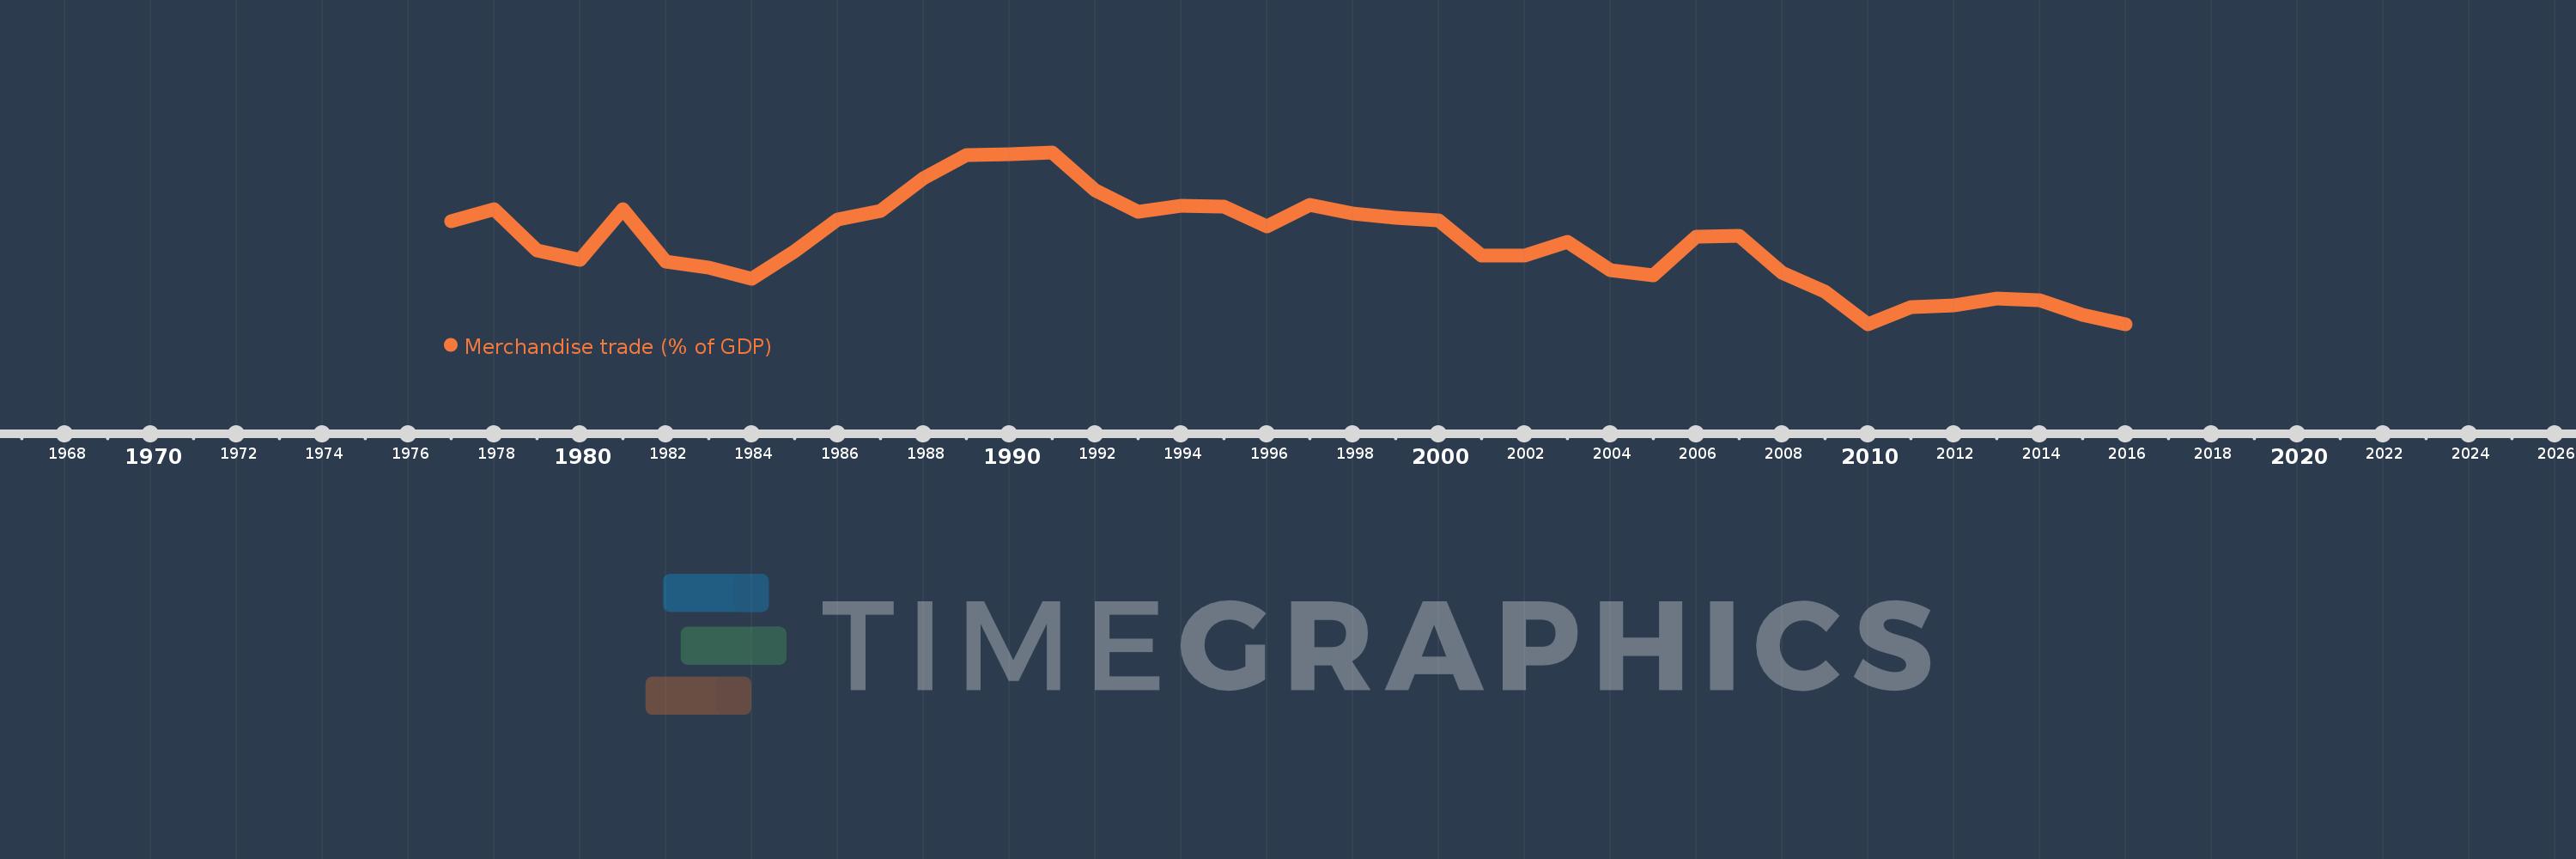
This timeline shows a graph from 1977 to 2016 of Mauritius. No data until 1976. Number of actual observations by date: 40.
Source name:
World Development Indicators
Source organization:
World Trade Organization, and World Bank GDP estimates.
Categories, topics:
Private Sector, Trade
Last updated:
apr 23, 2017
Indicators value changes by year
Minimum:
62.051
jan 1, 2016
Maximum:
105.974
jan 1, 1991
At the date of observation
Value
Absolute change
Change from previous value
jan 1, 1977
88.464
+88.464
0.0%
jan 1, 1978
91.439
+2.975
3.36%
jan 1, 1979
80.819
-10.621
-11.62%
jan 1, 1980
78.536
-2.283
-2.82%
jan 1, 1981
91.506
+12.97
16.51%
jan 1, 1982
78.017
-13.489
-14.74%
jan 1, 1983
76.459
-1.558
-2.0%
jan 1, 1984
73.708
-2.75
-3.6%
jan 1, 1985
80.675
+6.967
9.45%
jan 1, 1986
88.744
+8.068
10.0%
jan 1, 1987
91.08
+2.336
2.63%
jan 1, 1988
99.378
+8.298
9.11%
jan 1, 1989
105.203
+5.825
5.86%
jan 1, 1990
105.472
+0.27
0.26%
jan 1, 1991
105.974
+0.502
0.48%
jan 1, 1992
96.364
-9.611
-9.07%
jan 1, 1993
90.78
-5.583
-5.79%
jan 1, 1994
92.359
+1.578
1.74%
jan 1, 1995
92.099
-0.26
-0.28%
jan 1, 1996
86.973
-5.126
-5.57%
jan 1, 1997
92.516
+5.543
6.37%
jan 1, 1998
90.295
-2.22
-2.4%
jan 1, 1999
89.168
-1.128
-1.25%
jan 1, 2000
88.577
-0.591
-0.66%
jan 1, 2001
79.65
-8.927
-10.08%
jan 1, 2002
79.674
+0.024
0.03%
jan 1, 2003
83.078
+3.405
4.27%
jan 1, 2004
75.964
-7.114
-8.56%
jan 1, 2005
74.605
-1.359
-1.79%
jan 1, 2006
84.348
+9.743
13.06%
jan 1, 2007
84.731
+0.383
0.45%
jan 1, 2008
75.232
-9.499
-11.21%
jan 1, 2009
70.422
-4.81
-6.39%
jan 1, 2010
62.125
-8.297
-11.78%
jan 1, 2011
66.447
+4.323
6.96%
jan 1, 2012
66.969
+0.522
0.79%
jan 1, 2013
68.589
+1.619
2.42%
jan 1, 2014
68.146
-0.443
-0.65%
jan 1, 2015
64.514
-3.632
-5.33%
jan 1, 2016
62.051
-2.462
-3.82%
Ranking of countries by current statistics by years


Comments: