29
/
en
AIzaSyAYiBZKx7MnpbEhh9jyipgxe19OcubqV5w
April 1, 2024
165136
Jordan
JOR
true
2
1
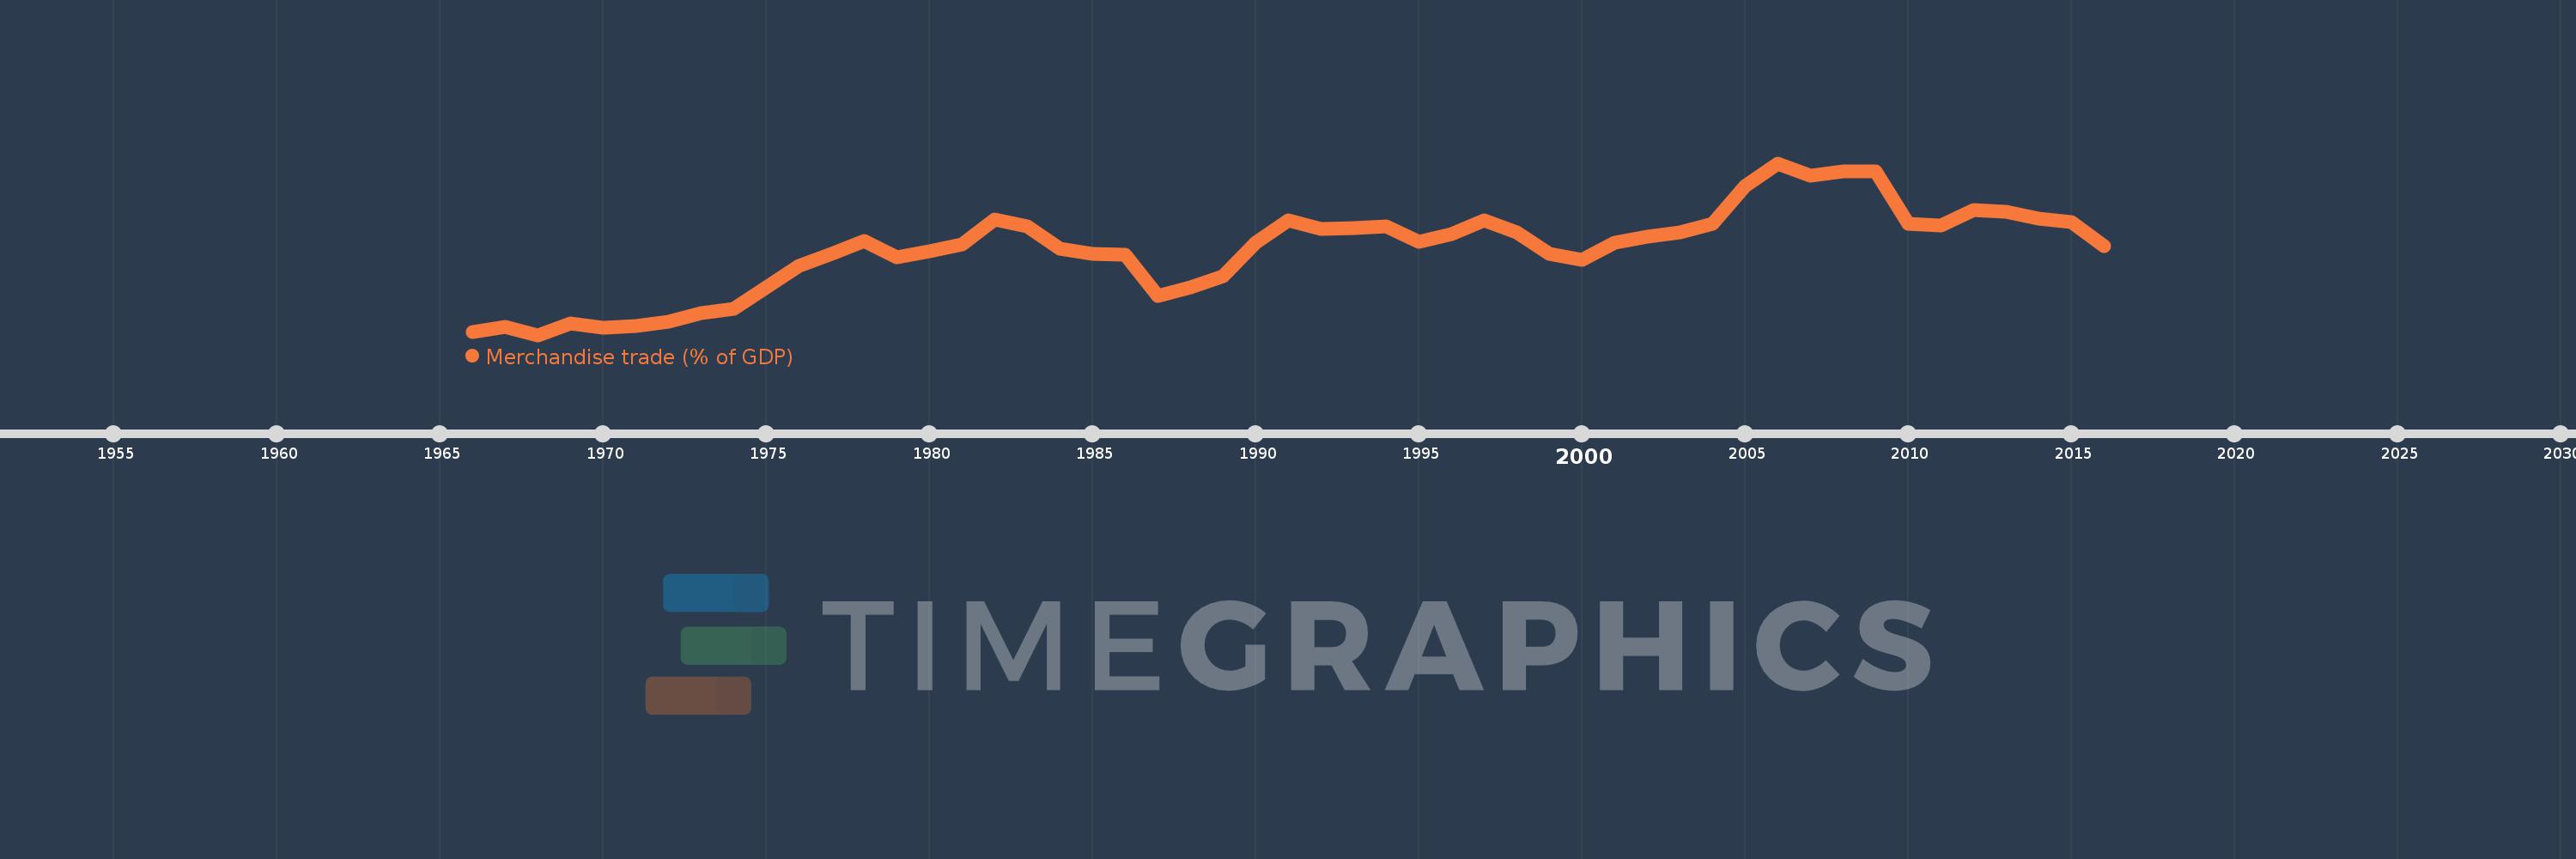
Merchandise trade (% of GDP)
2016,2015,2014,2013,2012,2011,2010,2009,2008,2007,2006,2005,2004,2003,2002,2001,2000,1999,1998,1997,1996,1995,1994,1993,1992,1991,1990,1989,1988,1987,1986,1985,1984,1983,1982,1981,1980,1979,1978,1977,1976,1975,1974,1973,1972,1971,1970,1969,1968,1967,1966
This statistics in other country:
AfghanistanAlbaniaAlgeriaAngolaAntigua and BarbudaArab WorldArgentinaArmeniaArubaAustraliaAustriaAzerbaijanBahamas, TheBahrainBangladeshBarbadosBelarusBelgiumBelizeBeninBermudaBhutanBoliviaBosnia and HerzegovinaBotswanaBrazilBrunei DarussalamBulgariaBurkina FasoBurundiCabo VerdeCambodiaCameroonCanadaCaribbean small statesCentral African RepublicCentral Europe and the BalticsChadChileChinaColombiaComorosCongo, Dem. Rep.Congo, Rep.Costa RicaCote d'IvoireCroatiaCubaCyprusCzech RepublicDenmarkDjiboutiDominicaDominican RepublicEarly-demographic dividendEast Asia & PacificEast Asia & Pacific (excluding high income)East Asia & Pacific (IDA & IBRD countries)EcuadorEgypt, Arab Rep.El SalvadorEquatorial GuineaEritreaEstoniaEthiopiaEuro areaEurope & Central AsiaEurope & Central Asia (excluding high income)Europe & Central Asia (IDA & IBRD countries)European UnionFaroe IslandsFijiFinlandFragile and conflict affected situationsFranceFrench PolynesiaGabonGambia, TheGeorgiaGermanyGhanaGreeceGreenlandGrenadaGuatemalaGuineaGuinea-BissauGuyanaHaitiHeavily indebted poor countries (HIPC)High incomeHondurasHong Kong SAR, ChinaHungaryIBRD onlyIcelandIDA & IBRD totalIDA blendIDA onlyIDA totalIndiaIndonesiaIran, Islamic Rep.IraqIrelandIsraelItalyJamaicaJapanJordanKazakhstanKenyaKiribatiKorea, Rep.KuwaitKyrgyz RepublicLao PDRLate-demographic dividendLatin America & Caribbean Latin America & Caribbean (excluding high income)Latin America & the Caribbean (IDA & IBRD countries)LatviaLeast developed countries: UN classificationLebanonLesothoLiberiaLibyaLithuaniaLow & middle incomeLow incomeLower middle incomeLuxembourgMacao SAR, ChinaMacedonia, FYRMadagascarMalawiMalaysiaMaldivesMaliMaltaMarshall IslandsMauritaniaMauritiusMexicoMicronesia, Fed. Sts.Middle East & North AfricaMiddle East & North Africa (excluding high income)Middle East & North Africa (IDA & IBRD countries)Middle incomeMoldovaMongoliaMontenegroMoroccoMozambiqueMyanmarNamibiaNepalNetherlandsNew CaledoniaNew ZealandNicaraguaNigerNigeriaNorth AmericaNorwayOECD membersOmanOther small statesPacific island small statesPakistanPalauPanamaPapua New GuineaParaguayPeruPhilippinesPolandPortugalPost-demographic dividendPre-demographic dividendQatarRomaniaRussian FederationRwandaSamoaSao Tome and PrincipeSaudi ArabiaSenegalSerbiaSeychellesSierra LeoneSingaporeSlovak RepublicSloveniaSmall statesSolomon IslandsSouth AfricaSouth AsiaSouth Asia (IDA & IBRD)SpainSri LankaSt. Kitts and NevisSt. LuciaSt. Vincent and the GrenadinesSub-Saharan Africa Sub-Saharan Africa (excluding high income)Sub-Saharan Africa (IDA & IBRD countries)SudanSurinameSwazilandSwedenSwitzerlandSyrian Arab RepublicTajikistanTanzaniaThailandTimor-LesteTogoTongaTrinidad and TobagoTunisiaTurkeyTurkmenistanTuvaluUgandaUkraineUnited Arab EmiratesUnited KingdomUnited StatesUpper middle incomeUruguayUzbekistanVanuatuVenezuela, RBVietnamWorldYemen, Rep.ZambiaZimbabwe Timeline:
This timeline shows a graph from 1966 to 2016 of Jordan. No data until 1965. Number of actual observations by date: 51.
Source name:
World Development Indicators
Source organization:
World Trade Organization, and World Bank GDP estimates.
Categories, topics:
Private Sector, Trade
Last updated:
apr 23, 2017
Indicators value changes by year
Minimum:
29.398
jan 1, 1968
Maximum:
117.562
jan 1, 2006
At the date of observation
Value
Absolute change
Change from previous value
jan 1, 1966
30.8
+30.8
0.0%
jan 1, 1967
33.425
+2.626
8.52%
jan 1, 1968
29.398
-4.028
-12.05%
jan 1, 1969
35.368
+5.97
20.31%
jan 1, 1970
33.02
-2.347
-6.64%
jan 1, 1971
34.152
+1.132
3.43%
jan 1, 1972
36.362
+2.21
6.47%
jan 1, 1973
40.742
+4.38
12.05%
jan 1, 1974
42.746
+2.003
4.92%
jan 1, 1975
53.691
+10.946
25.61%
jan 1, 1976
64.933
+11.242
20.94%
jan 1, 1977
70.983
+6.05
9.32%
jan 1, 1978
77.758
+6.776
9.55%
jan 1, 1979
69.209
-8.549
-10.99%
jan 1, 1980
72.322
+3.112
4.5%
jan 1, 1981
76.112
+3.79
5.24%
jan 1, 1982
88.9
+12.789
16.8%
jan 1, 1983
85.289
-3.612
-4.06%
jan 1, 1984
73.49
-11.799
-13.83%
jan 1, 1985
71.194
-2.296
-3.12%
jan 1, 1986
70.527
-0.667
-0.94%
jan 1, 1987
49.442
-21.085
-29.9%
jan 1, 1988
53.881
+4.439
8.98%
jan 1, 1989
59.756
+5.875
10.9%
jan 1, 1990
76.594
+16.838
28.18%
jan 1, 1991
88.077
+11.483
14.99%
jan 1, 1992
83.743
-4.334
-4.92%
jan 1, 1993
84.16
+0.417
0.5%
jan 1, 1994
85.357
+1.198
1.42%
jan 1, 1995
77.031
-8.326
-9.75%
jan 1, 1996
81.249
+4.218
5.48%
jan 1, 1997
88.174
+6.925
8.52%
jan 1, 1998
81.967
-6.207
-7.04%
jan 1, 1999
71.17
-10.797
-13.17%
jan 1, 2000
68.107
-3.063
-4.3%
jan 1, 2001
76.804
+8.697
12.77%
jan 1, 2002
79.838
+3.034
3.95%
jan 1, 2003
81.896
+2.059
2.58%
jan 1, 2004
86.577
+4.68
5.71%
jan 1, 2005
105.741
+19.164
22.14%
jan 1, 2006
117.562
+11.821
11.18%
jan 1, 2007
111.262
-6.3
-5.36%
jan 1, 2008
113.419
+2.157
1.94%
jan 1, 2009
113.476
+0.057
0.05%
jan 1, 2010
86.535
-26.94
-23.74%
jan 1, 2011
85.493
-1.042
-1.2%
jan 1, 2012
93.398
+7.905
9.25%
jan 1, 2013
92.569
-0.829
-0.89%
jan 1, 2014
89.241
-3.328
-3.6%
jan 1, 2015
87.407
-1.834
-2.05%
jan 1, 2016
75.061
-12.346
-14.12%
Ranking of countries by current statistics by years


Comments: