29
/
en
AIzaSyAYiBZKx7MnpbEhh9jyipgxe19OcubqV5w
April 1, 2024
69022
Antigua and Barbuda
ATG
true
2
1
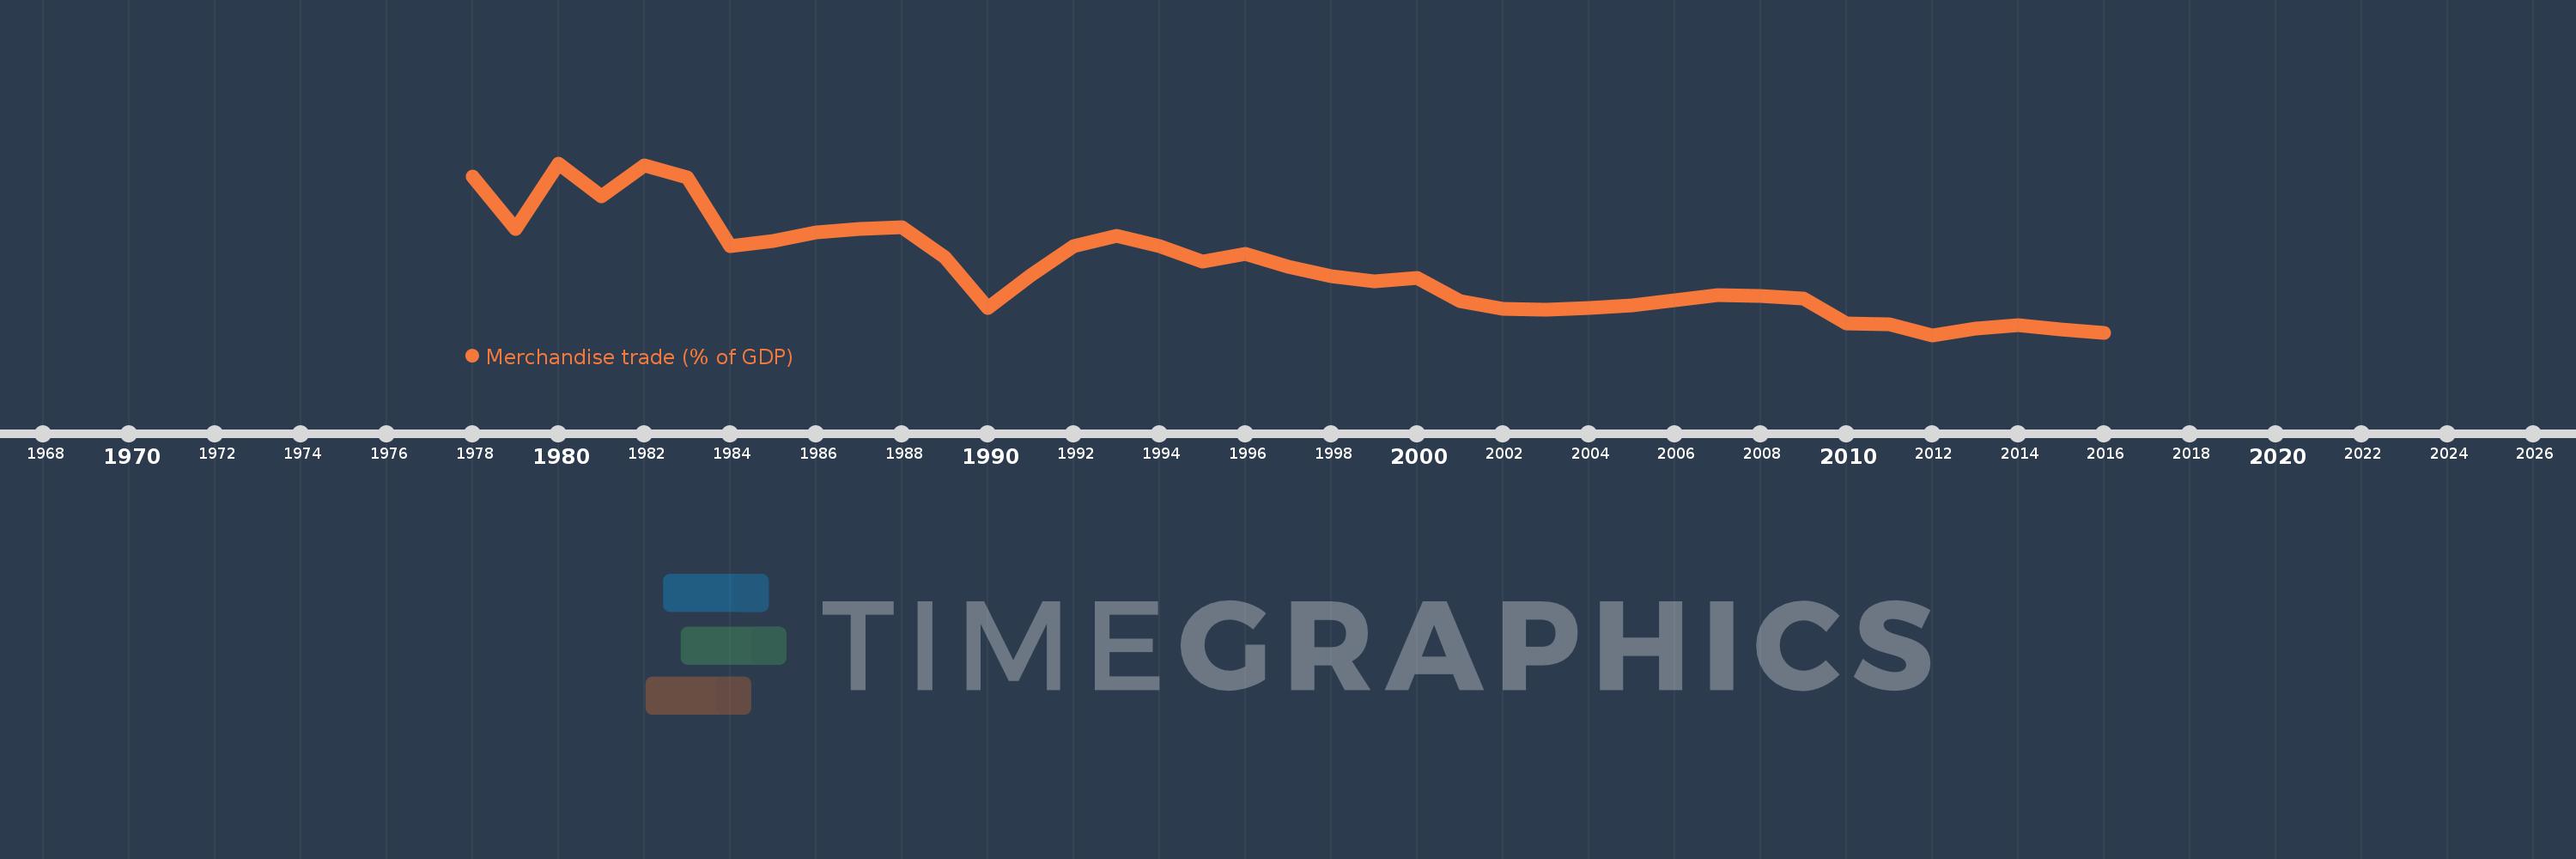
Merchandise trade (% of GDP)
2016,2015,2014,2013,2012,2011,2010,2009,2008,2007,2006,2005,2004,2003,2002,2001,2000,1999,1998,1997,1996,1995,1994,1993,1992,1991,1990,1989,1988,1987,1986,1985,1984,1983,1982,1981,1980,1979,1978
This statistics in other country:
AfghanistanAlbaniaAlgeriaAngolaAntigua and BarbudaArab WorldArgentinaArmeniaArubaAustraliaAustriaAzerbaijanBahamas, TheBahrainBangladeshBarbadosBelarusBelgiumBelizeBeninBermudaBhutanBoliviaBosnia and HerzegovinaBotswanaBrazilBrunei DarussalamBulgariaBurkina FasoBurundiCabo VerdeCambodiaCameroonCanadaCaribbean small statesCentral African RepublicCentral Europe and the BalticsChadChileChinaColombiaComorosCongo, Dem. Rep.Congo, Rep.Costa RicaCote d'IvoireCroatiaCubaCyprusCzech RepublicDenmarkDjiboutiDominicaDominican RepublicEarly-demographic dividendEast Asia & PacificEast Asia & Pacific (excluding high income)East Asia & Pacific (IDA & IBRD countries)EcuadorEgypt, Arab Rep.El SalvadorEquatorial GuineaEritreaEstoniaEthiopiaEuro areaEurope & Central AsiaEurope & Central Asia (excluding high income)Europe & Central Asia (IDA & IBRD countries)European UnionFaroe IslandsFijiFinlandFragile and conflict affected situationsFranceFrench PolynesiaGabonGambia, TheGeorgiaGermanyGhanaGreeceGreenlandGrenadaGuatemalaGuineaGuinea-BissauGuyanaHaitiHeavily indebted poor countries (HIPC)High incomeHondurasHong Kong SAR, ChinaHungaryIBRD onlyIcelandIDA & IBRD totalIDA blendIDA onlyIDA totalIndiaIndonesiaIran, Islamic Rep.IraqIrelandIsraelItalyJamaicaJapanJordanKazakhstanKenyaKiribatiKorea, Rep.KuwaitKyrgyz RepublicLao PDRLate-demographic dividendLatin America & Caribbean Latin America & Caribbean (excluding high income)Latin America & the Caribbean (IDA & IBRD countries)LatviaLeast developed countries: UN classificationLebanonLesothoLiberiaLibyaLithuaniaLow & middle incomeLow incomeLower middle incomeLuxembourgMacao SAR, ChinaMacedonia, FYRMadagascarMalawiMalaysiaMaldivesMaliMaltaMarshall IslandsMauritaniaMauritiusMexicoMicronesia, Fed. Sts.Middle East & North AfricaMiddle East & North Africa (excluding high income)Middle East & North Africa (IDA & IBRD countries)Middle incomeMoldovaMongoliaMontenegroMoroccoMozambiqueMyanmarNamibiaNepalNetherlandsNew CaledoniaNew ZealandNicaraguaNigerNigeriaNorth AmericaNorwayOECD membersOmanOther small statesPacific island small statesPakistanPalauPanamaPapua New GuineaParaguayPeruPhilippinesPolandPortugalPost-demographic dividendPre-demographic dividendQatarRomaniaRussian FederationRwandaSamoaSao Tome and PrincipeSaudi ArabiaSenegalSerbiaSeychellesSierra LeoneSingaporeSlovak RepublicSloveniaSmall statesSolomon IslandsSouth AfricaSouth AsiaSouth Asia (IDA & IBRD)SpainSri LankaSt. Kitts and NevisSt. LuciaSt. Vincent and the GrenadinesSub-Saharan Africa Sub-Saharan Africa (excluding high income)Sub-Saharan Africa (IDA & IBRD countries)SudanSurinameSwazilandSwedenSwitzerlandSyrian Arab RepublicTajikistanTanzaniaThailandTimor-LesteTogoTongaTrinidad and TobagoTunisiaTurkeyTurkmenistanTuvaluUgandaUkraineUnited Arab EmiratesUnited KingdomUnited StatesUpper middle incomeUruguayUzbekistanVanuatuVenezuela, RBVietnamWorldYemen, Rep.ZambiaZimbabwe Timeline:
This timeline shows a graph from 1978 to 2016 of Antigua and Barbuda. No data until 1977. Number of actual observations by date: 39.
Source name:
World Development Indicators
Source organization:
World Trade Organization, and World Bank GDP estimates.
Categories, topics:
Private Sector, Trade
Last updated:
apr 23, 2017
Indicators value changes by year
Minimum:
43.065
jan 1, 2012
Maximum:
122.506
jan 1, 1980
At the date of observation
Value
Absolute change
Change from previous value
jan 1, 1978
116.412
+116.412
0.0%
jan 1, 1979
92.178
-24.234
-20.82%
jan 1, 1980
122.506
+30.328
32.9%
jan 1, 1981
107.208
-15.298
-12.49%
jan 1, 1982
121.321
+14.113
13.16%
jan 1, 1983
115.982
-5.339
-4.4%
jan 1, 1984
84.165
-31.817
-27.43%
jan 1, 1985
86.45
+2.285
2.71%
jan 1, 1986
90.656
+4.206
4.86%
jan 1, 1987
92.315
+1.66
1.83%
jan 1, 1988
92.853
+0.538
0.58%
jan 1, 1989
78.832
-14.021
-15.1%
jan 1, 1990
55.704
-23.128
-29.34%
jan 1, 1991
70.485
+14.782
26.54%
jan 1, 1992
84.067
+13.581
19.27%
jan 1, 1993
88.965
+4.898
5.83%
jan 1, 1994
84.331
-4.634
-5.21%
jan 1, 1995
77.186
-7.144
-8.47%
jan 1, 1996
80.739
+3.553
4.6%
jan 1, 1997
74.481
-6.257
-7.75%
jan 1, 1998
70.363
-4.119
-5.53%
jan 1, 1999
67.899
-2.464
-3.5%
jan 1, 2000
69.341
+1.442
2.12%
jan 1, 2001
58.558
-10.783
-15.55%
jan 1, 2002
55.185
-3.373
-5.76%
jan 1, 2003
54.702
-0.483
-0.87%
jan 1, 2004
55.645
+0.943
1.72%
jan 1, 2005
56.875
+1.229
2.21%
jan 1, 2006
59.055
+2.18
3.83%
jan 1, 2007
61.506
+2.451
4.15%
jan 1, 2008
61.09
-0.416
-0.68%
jan 1, 2009
59.984
-1.106
-1.81%
jan 1, 2010
48.464
-11.52
-19.21%
jan 1, 2011
48.166
-0.298
-0.62%
jan 1, 2012
43.065
-5.101
-10.59%
jan 1, 2013
46.094
+3.03
7.04%
jan 1, 2014
47.545
+1.45
3.15%
jan 1, 2015
45.461
-2.084
-4.38%
jan 1, 2016
44.074
-1.388
-3.05%
Ranking of countries by current statistics by years


Comments: