29
/
en
AIzaSyAYiBZKx7MnpbEhh9jyipgxe19OcubqV5w
April 1, 2024
214577
Norway
NOR
true
2
1
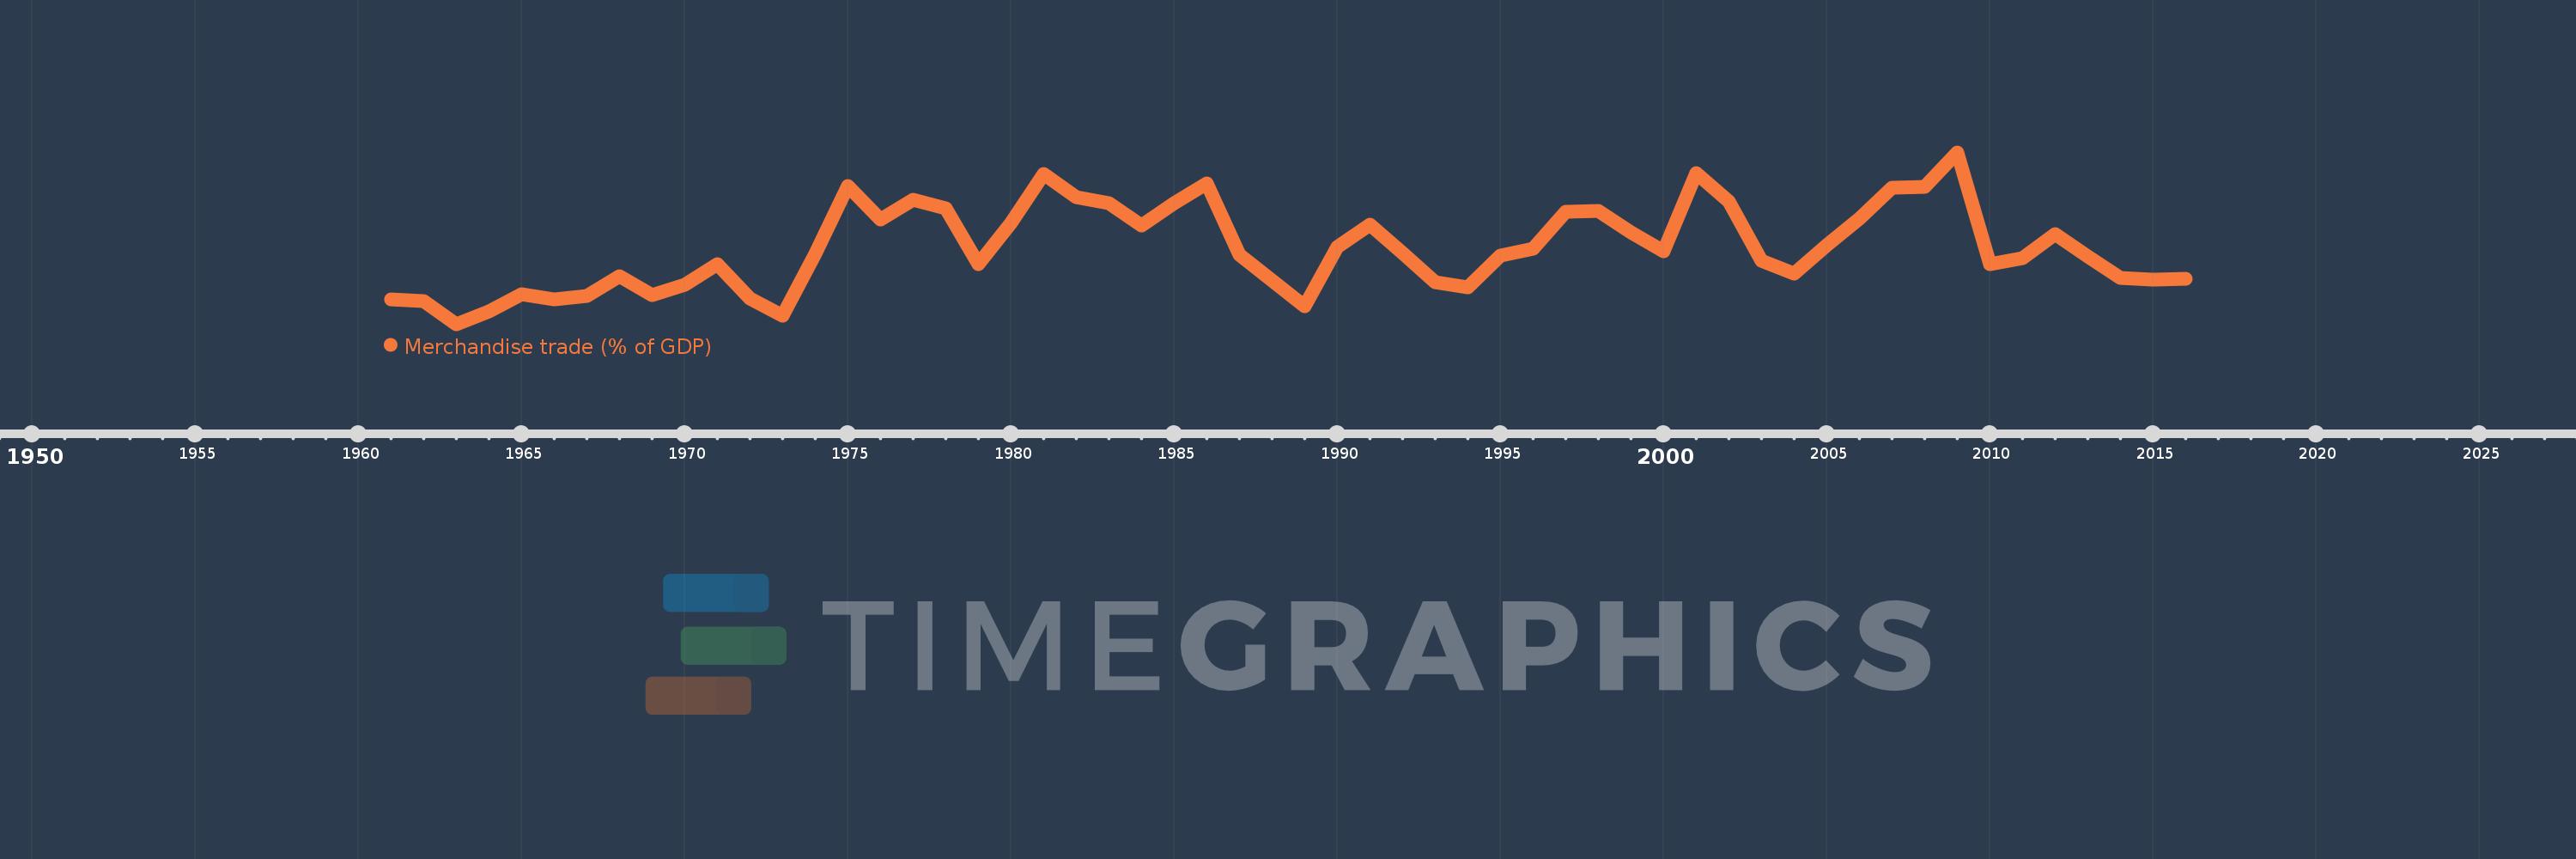
Merchandise trade (% of GDP)
2016,2015,2014,2013,2012,2011,2010,2009,2008,2007,2006,2005,2004,2003,2002,2001,2000,1999,1998,1997,1996,1995,1994,1993,1992,1991,1990,1989,1988,1987,1986,1985,1984,1983,1982,1981,1980,1979,1978,1977,1976,1975,1974,1973,1972,1971,1970,1969,1968,1967,1966,1965,1964,1963,1962,1961
This statistics in other country:
AfghanistanAlbaniaAlgeriaAngolaAntigua and BarbudaArab WorldArgentinaArmeniaArubaAustraliaAustriaAzerbaijanBahamas, TheBahrainBangladeshBarbadosBelarusBelgiumBelizeBeninBermudaBhutanBoliviaBosnia and HerzegovinaBotswanaBrazilBrunei DarussalamBulgariaBurkina FasoBurundiCabo VerdeCambodiaCameroonCanadaCaribbean small statesCentral African RepublicCentral Europe and the BalticsChadChileChinaColombiaComorosCongo, Dem. Rep.Congo, Rep.Costa RicaCote d'IvoireCroatiaCubaCyprusCzech RepublicDenmarkDjiboutiDominicaDominican RepublicEarly-demographic dividendEast Asia & PacificEast Asia & Pacific (excluding high income)East Asia & Pacific (IDA & IBRD countries)EcuadorEgypt, Arab Rep.El SalvadorEquatorial GuineaEritreaEstoniaEthiopiaEuro areaEurope & Central AsiaEurope & Central Asia (excluding high income)Europe & Central Asia (IDA & IBRD countries)European UnionFaroe IslandsFijiFinlandFragile and conflict affected situationsFranceFrench PolynesiaGabonGambia, TheGeorgiaGermanyGhanaGreeceGreenlandGrenadaGuatemalaGuineaGuinea-BissauGuyanaHaitiHeavily indebted poor countries (HIPC)High incomeHondurasHong Kong SAR, ChinaHungaryIBRD onlyIcelandIDA & IBRD totalIDA blendIDA onlyIDA totalIndiaIndonesiaIran, Islamic Rep.IraqIrelandIsraelItalyJamaicaJapanJordanKazakhstanKenyaKiribatiKorea, Rep.KuwaitKyrgyz RepublicLao PDRLate-demographic dividendLatin America & Caribbean Latin America & Caribbean (excluding high income)Latin America & the Caribbean (IDA & IBRD countries)LatviaLeast developed countries: UN classificationLebanonLesothoLiberiaLibyaLithuaniaLow & middle incomeLow incomeLower middle incomeLuxembourgMacao SAR, ChinaMacedonia, FYRMadagascarMalawiMalaysiaMaldivesMaliMaltaMarshall IslandsMauritaniaMauritiusMexicoMicronesia, Fed. Sts.Middle East & North AfricaMiddle East & North Africa (excluding high income)Middle East & North Africa (IDA & IBRD countries)Middle incomeMoldovaMongoliaMontenegroMoroccoMozambiqueMyanmarNamibiaNepalNetherlandsNew CaledoniaNew ZealandNicaraguaNigerNigeriaNorth AmericaNorwayOECD membersOmanOther small statesPacific island small statesPakistanPalauPanamaPapua New GuineaParaguayPeruPhilippinesPolandPortugalPost-demographic dividendPre-demographic dividendQatarRomaniaRussian FederationRwandaSamoaSao Tome and PrincipeSaudi ArabiaSenegalSerbiaSeychellesSierra LeoneSingaporeSlovak RepublicSloveniaSmall statesSolomon IslandsSouth AfricaSouth AsiaSouth Asia (IDA & IBRD)SpainSri LankaSt. Kitts and NevisSt. LuciaSt. Vincent and the GrenadinesSub-Saharan Africa Sub-Saharan Africa (excluding high income)Sub-Saharan Africa (IDA & IBRD countries)SudanSurinameSwazilandSwedenSwitzerlandSyrian Arab RepublicTajikistanTanzaniaThailandTimor-LesteTogoTongaTrinidad and TobagoTunisiaTurkeyTurkmenistanTuvaluUgandaUkraineUnited Arab EmiratesUnited KingdomUnited StatesUpper middle incomeUruguayUzbekistanVanuatuVenezuela, RBVietnamWorldYemen, Rep.ZambiaZimbabwe Timeline:
This timeline shows a graph from 1961 to 2016 of Norway. No data until 1960. Number of actual observations by date: 56.
Source name:
World Development Indicators
Source organization:
World Trade Organization, and World Bank GDP estimates.
Categories, topics:
Private Sector, Trade
Last updated:
apr 23, 2017
Indicators value changes by year
Minimum:
43.445
jan 1, 1963
Maximum:
56.729
jan 1, 2009
At the date of observation
Value
Absolute change
Change from previous value
jan 1, 1961
45.382
+45.382
0.0%
jan 1, 1962
45.225
-0.156
-0.34%
jan 1, 1963
43.445
-1.781
-3.94%
jan 1, 1964
44.465
+1.02
2.35%
jan 1, 1965
45.736
+1.271
2.86%
jan 1, 1966
45.335
-0.4
-0.88%
jan 1, 1967
45.618
+0.283
0.62%
jan 1, 1968
47.142
+1.524
3.34%
jan 1, 1969
45.71
-1.432
-3.04%
jan 1, 1970
46.509
+0.799
1.75%
jan 1, 1971
48.063
+1.555
3.34%
jan 1, 1972
45.463
-2.6
-5.41%
jan 1, 1973
44.104
-1.359
-2.99%
jan 1, 1974
48.878
+4.774
10.82%
jan 1, 1975
54.161
+5.283
10.81%
jan 1, 1976
51.512
-2.649
-4.89%
jan 1, 1977
53.061
+1.549
3.01%
jan 1, 1978
52.43
-0.631
-1.19%
jan 1, 1979
48.104
-4.326
-8.25%
jan 1, 1980
51.292
+3.188
6.63%
jan 1, 1981
55.073
+3.782
7.37%
jan 1, 1982
53.256
-1.818
-3.3%
jan 1, 1983
52.788
-0.468
-0.88%
jan 1, 1984
51.104
-1.684
-3.19%
jan 1, 1985
52.807
+1.703
3.33%
jan 1, 1986
54.332
+1.524
2.89%
jan 1, 1987
48.788
-5.543
-10.2%
jan 1, 1988
46.831
-1.957
-4.01%
jan 1, 1989
44.805
-2.027
-4.33%
jan 1, 1990
49.426
+4.622
10.32%
jan 1, 1991
51.154
+1.728
3.5%
jan 1, 1992
48.968
-2.185
-4.27%
jan 1, 1993
46.686
-2.282
-4.66%
jan 1, 1994
46.284
-0.402
-0.86%
jan 1, 1995
48.768
+2.483
5.37%
jan 1, 1996
49.307
+0.539
1.11%
jan 1, 1997
52.141
+2.834
5.75%
jan 1, 1998
52.214
+0.073
0.14%
jan 1, 1999
50.517
-1.696
-3.25%
jan 1, 2000
49.081
-1.436
-2.84%
jan 1, 2001
55.132
+6.051
12.33%
jan 1, 2002
52.956
-2.176
-3.95%
jan 1, 2003
48.376
-4.581
-8.65%
jan 1, 2004
47.377
-0.999
-2.06%
jan 1, 2005
49.577
+2.2
4.64%
jan 1, 2006
51.583
+2.006
4.05%
jan 1, 2007
53.983
+2.4
4.65%
jan 1, 2008
54.044
+0.061
0.11%
jan 1, 2009
56.729
+2.685
4.97%
jan 1, 2010
48.073
-8.655
-15.26%
jan 1, 2011
48.536
+0.462
0.96%
jan 1, 2012
50.424
+1.889
3.89%
jan 1, 2013
48.707
-1.718
-3.41%
jan 1, 2014
47.027
-1.68
-3.45%
jan 1, 2015
46.911
-0.116
-0.25%
jan 1, 2016
46.976
+0.065
0.14%
Ranking of countries by current statistics by years


Comments: