29
/
en
AIzaSyAYiBZKx7MnpbEhh9jyipgxe19OcubqV5w
April 1, 2024
27491
East Asia & Pacific
EAS
false
2
1
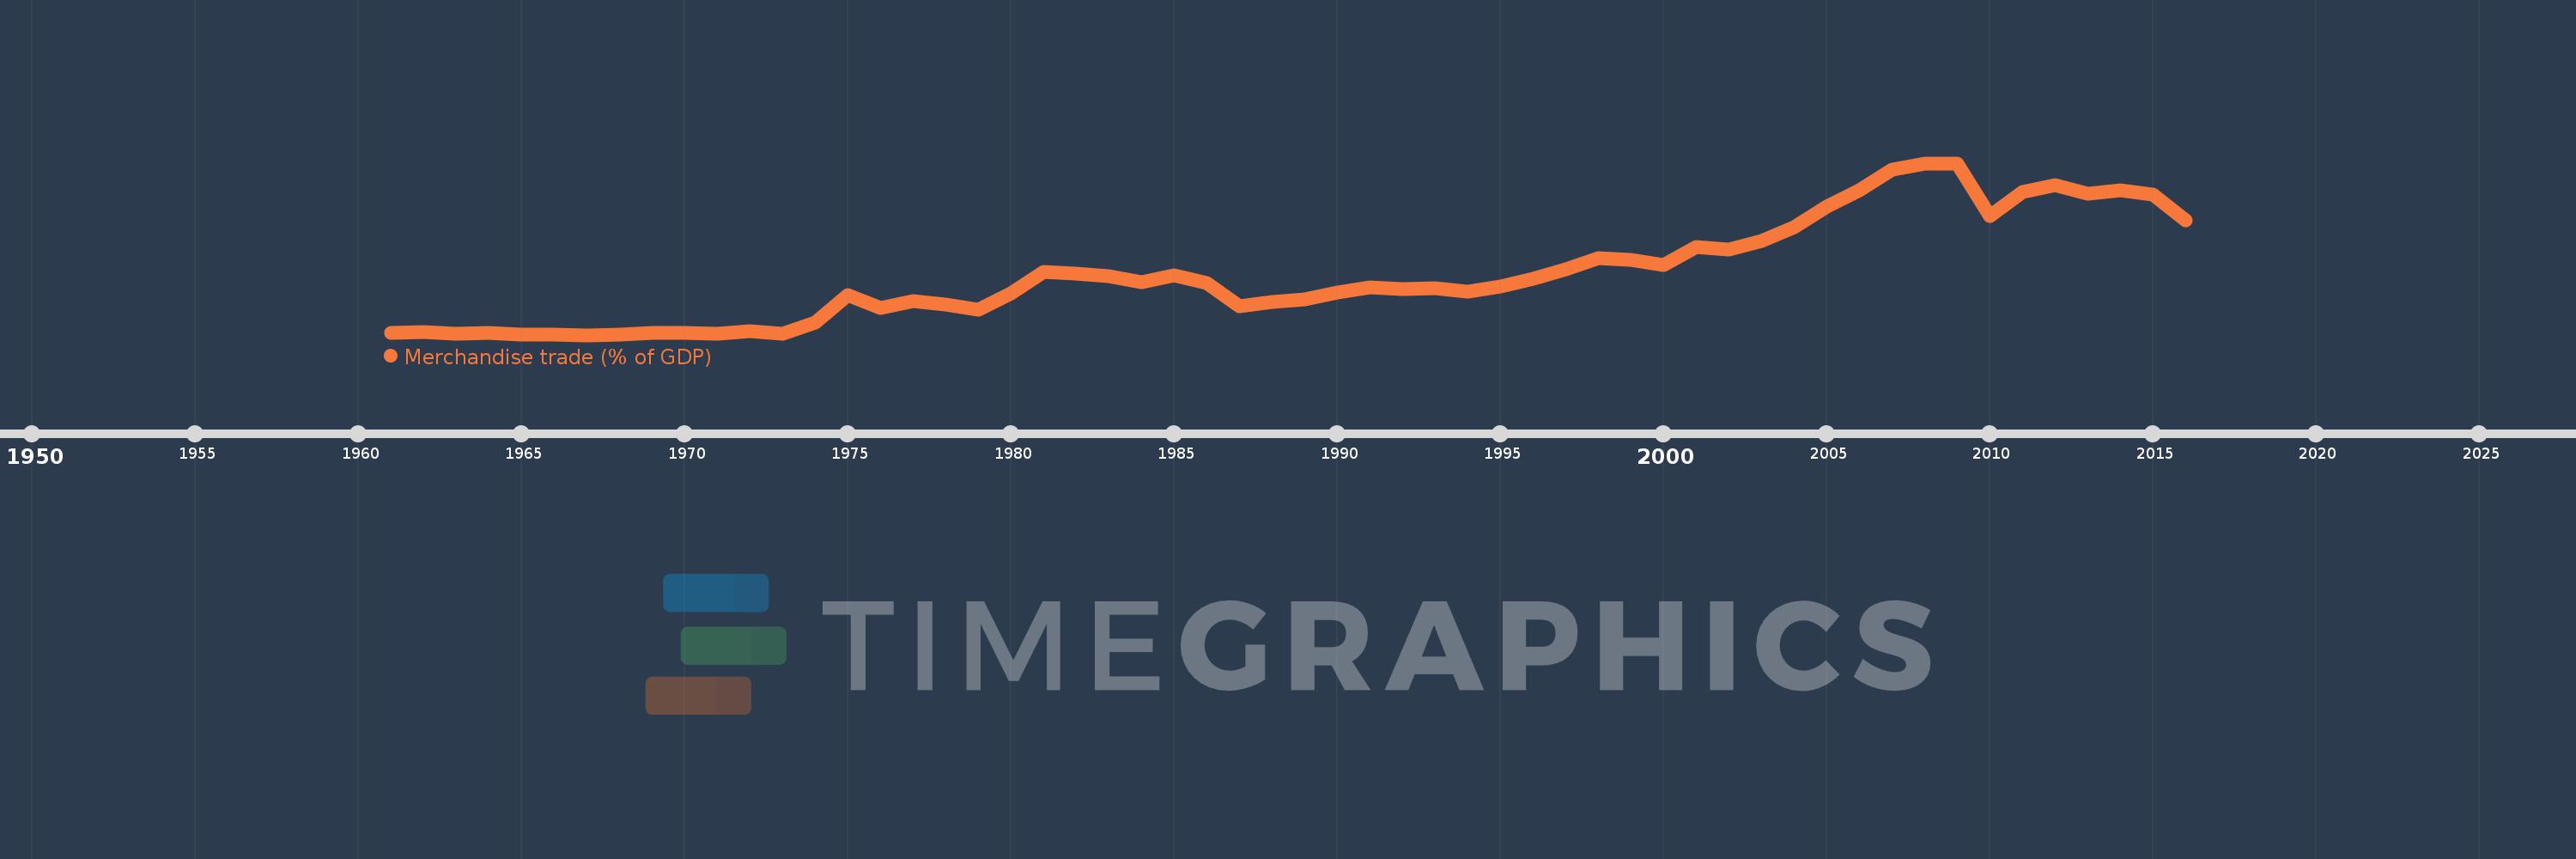
Merchandise trade (% of GDP)
2016,2015,2014,2013,2012,2011,2010,2009,2008,2007,2006,2005,2004,2003,2002,2001,2000,1999,1998,1997,1996,1995,1994,1993,1992,1991,1990,1989,1988,1987,1986,1985,1984,1983,1982,1981,1980,1979,1978,1977,1976,1975,1974,1973,1972,1971,1970,1969,1968,1967,1966,1965,1964,1963,1962,1961
This statistics in other country:
AfghanistanAlbaniaAlgeriaAngolaAntigua and BarbudaArab WorldArgentinaArmeniaArubaAustraliaAustriaAzerbaijanBahamas, TheBahrainBangladeshBarbadosBelarusBelgiumBelizeBeninBermudaBhutanBoliviaBosnia and HerzegovinaBotswanaBrazilBrunei DarussalamBulgariaBurkina FasoBurundiCabo VerdeCambodiaCameroonCanadaCaribbean small statesCentral African RepublicCentral Europe and the BalticsChadChileChinaColombiaComorosCongo, Dem. Rep.Congo, Rep.Costa RicaCote d'IvoireCroatiaCubaCyprusCzech RepublicDenmarkDjiboutiDominicaDominican RepublicEarly-demographic dividendEast Asia & PacificEast Asia & Pacific (excluding high income)East Asia & Pacific (IDA & IBRD countries)EcuadorEgypt, Arab Rep.El SalvadorEquatorial GuineaEritreaEstoniaEthiopiaEuro areaEurope & Central AsiaEurope & Central Asia (excluding high income)Europe & Central Asia (IDA & IBRD countries)European UnionFaroe IslandsFijiFinlandFragile and conflict affected situationsFranceFrench PolynesiaGabonGambia, TheGeorgiaGermanyGhanaGreeceGreenlandGrenadaGuatemalaGuineaGuinea-BissauGuyanaHaitiHeavily indebted poor countries (HIPC)High incomeHondurasHong Kong SAR, ChinaHungaryIBRD onlyIcelandIDA & IBRD totalIDA blendIDA onlyIDA totalIndiaIndonesiaIran, Islamic Rep.IraqIrelandIsraelItalyJamaicaJapanJordanKazakhstanKenyaKiribatiKorea, Rep.KuwaitKyrgyz RepublicLao PDRLate-demographic dividendLatin America & Caribbean Latin America & Caribbean (excluding high income)Latin America & the Caribbean (IDA & IBRD countries)LatviaLeast developed countries: UN classificationLebanonLesothoLiberiaLibyaLithuaniaLow & middle incomeLow incomeLower middle incomeLuxembourgMacao SAR, ChinaMacedonia, FYRMadagascarMalawiMalaysiaMaldivesMaliMaltaMarshall IslandsMauritaniaMauritiusMexicoMicronesia, Fed. Sts.Middle East & North AfricaMiddle East & North Africa (excluding high income)Middle East & North Africa (IDA & IBRD countries)Middle incomeMoldovaMongoliaMontenegroMoroccoMozambiqueMyanmarNamibiaNepalNetherlandsNew CaledoniaNew ZealandNicaraguaNigerNigeriaNorth AmericaNorwayOECD membersOmanOther small statesPacific island small statesPakistanPalauPanamaPapua New GuineaParaguayPeruPhilippinesPolandPortugalPost-demographic dividendPre-demographic dividendQatarRomaniaRussian FederationRwandaSamoaSao Tome and PrincipeSaudi ArabiaSenegalSerbiaSeychellesSierra LeoneSingaporeSlovak RepublicSloveniaSmall statesSolomon IslandsSouth AfricaSouth AsiaSouth Asia (IDA & IBRD)SpainSri LankaSt. Kitts and NevisSt. LuciaSt. Vincent and the GrenadinesSub-Saharan Africa Sub-Saharan Africa (excluding high income)Sub-Saharan Africa (IDA & IBRD countries)SudanSurinameSwazilandSwedenSwitzerlandSyrian Arab RepublicTajikistanTanzaniaThailandTimor-LesteTogoTongaTrinidad and TobagoTunisiaTurkeyTurkmenistanTuvaluUgandaUkraineUnited Arab EmiratesUnited KingdomUnited StatesUpper middle incomeUruguayUzbekistanVanuatuVenezuela, RBVietnamWorldYemen, Rep.ZambiaZimbabwe Timeline:
This timeline shows a graph from 1961 to 2016 of East Asia & Pacific. No data until 1960. Number of actual observations by date: 56.
Source name:
World Development Indicators
Source organization:
World Trade Organization, and World Bank GDP estimates.
Categories, topics:
Private Sector, Trade
Last updated:
apr 23, 2017
Indicators value changes by year
Minimum:
19.601
jan 1, 1967
Maximum:
62.241
jan 1, 2009
At the date of observation
Value
Absolute change
Change from previous value
jan 1, 1961
20.129
+20.129
0.0%
jan 1, 1962
20.296
+0.167
0.83%
jan 1, 1963
19.921
-0.375
-1.85%
jan 1, 1964
20.136
+0.215
1.08%
jan 1, 1965
19.701
-0.434
-2.16%
jan 1, 1966
19.766
+0.064
0.33%
jan 1, 1967
19.601
-0.164
-0.83%
jan 1, 1968
19.708
+0.106
0.54%
jan 1, 1969
20.09
+0.383
1.94%
jan 1, 1970
20.212
+0.122
0.61%
jan 1, 1971
20.014
-0.198
-0.98%
jan 1, 1972
20.65
+0.636
3.18%
jan 1, 1973
20.004
-0.646
-3.13%
jan 1, 1974
22.666
+2.662
13.31%
jan 1, 1975
29.585
+6.919
30.53%
jan 1, 1976
26.411
-3.174
-10.73%
jan 1, 1977
28.118
+1.707
6.46%
jan 1, 1978
27.186
-0.932
-3.31%
jan 1, 1979
25.843
-1.343
-4.94%
jan 1, 1980
29.85
+4.007
15.5%
jan 1, 1981
35.352
+5.502
18.43%
jan 1, 1982
34.929
-0.423
-1.2%
jan 1, 1983
34.148
-0.78
-2.23%
jan 1, 1984
32.728
-1.421
-4.16%
jan 1, 1985
34.313
+1.585
4.84%
jan 1, 1986
32.404
-1.909
-5.56%
jan 1, 1987
26.821
-5.582
-17.23%
jan 1, 1988
27.72
+0.898
3.35%
jan 1, 1989
28.466
+0.746
2.69%
jan 1, 1990
30.17
+1.704
5.99%
jan 1, 1991
31.535
+1.365
4.52%
jan 1, 1992
31.094
-0.441
-1.4%
jan 1, 1993
31.231
+0.138
0.44%
jan 1, 1994
30.39
-0.842
-2.69%
jan 1, 1995
31.604
+1.214
3.99%
jan 1, 1996
33.543
+1.939
6.14%
jan 1, 1997
35.891
+2.348
7.0%
jan 1, 1998
38.618
+2.727
7.6%
jan 1, 1999
38.237
-0.381
-0.99%
jan 1, 2000
36.984
-1.253
-3.28%
jan 1, 2001
41.474
+4.491
12.14%
jan 1, 2002
40.859
-0.616
-1.48%
jan 1, 2003
43.024
+2.165
5.3%
jan 1, 2004
46.356
+3.332
7.74%
jan 1, 2005
51.553
+5.197
11.21%
jan 1, 2006
55.609
+4.056
7.87%
jan 1, 2007
60.642
+5.033
9.05%
jan 1, 2008
62.071
+1.428
2.36%
jan 1, 2009
62.241
+0.17
0.27%
jan 1, 2010
49.115
-13.126
-21.09%
jan 1, 2011
55.138
+6.024
12.26%
jan 1, 2012
56.76
+1.622
2.94%
jan 1, 2013
54.777
-1.984
-3.49%
jan 1, 2014
55.587
+0.81
1.48%
jan 1, 2015
54.44
-1.147
-2.06%
jan 1, 2016
48.054
-6.386
-11.73%
Ranking of countries by current statistics by years


Comments: