29
/
en
AIzaSyAYiBZKx7MnpbEhh9jyipgxe19OcubqV5w
April 1, 2024
251036
St. Lucia
LCA
true
2
1
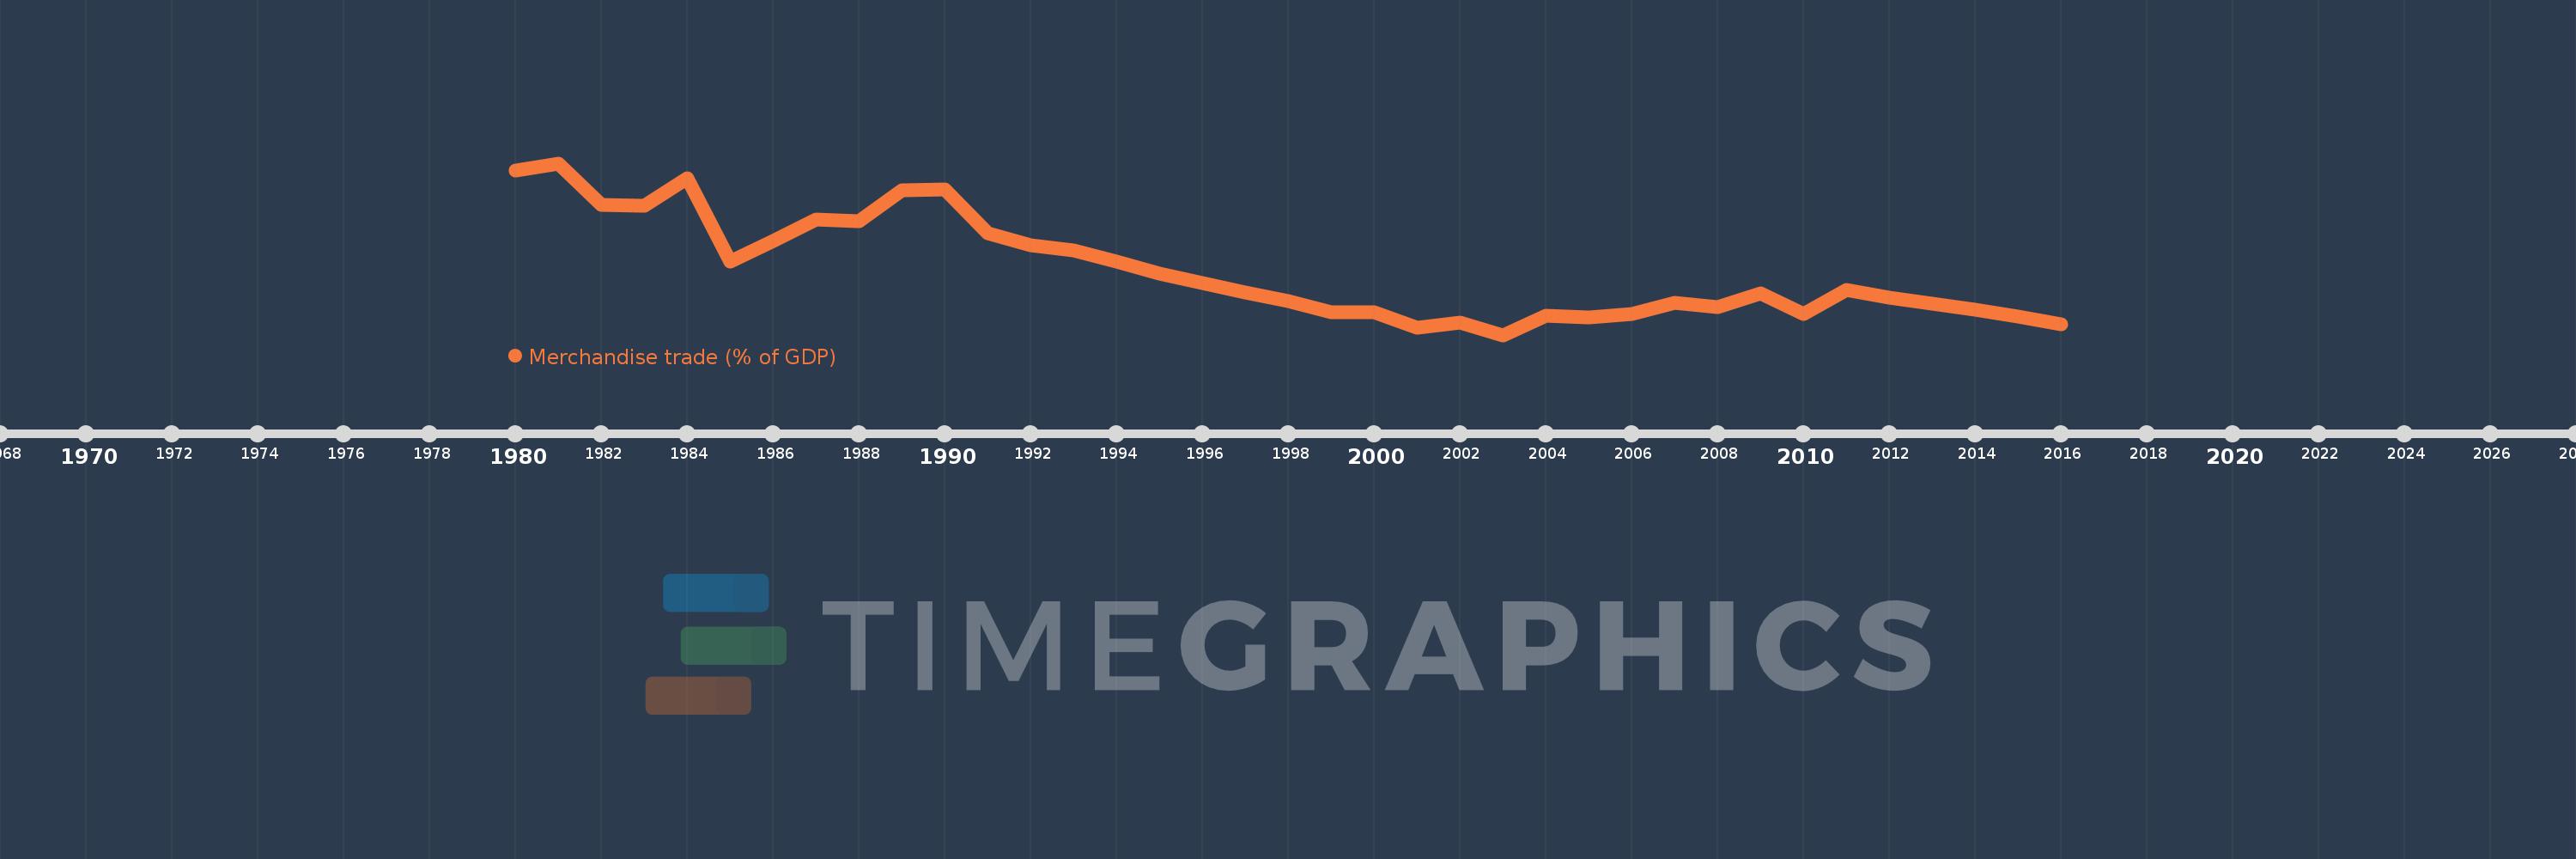
Merchandise trade (% of GDP)
2016,2015,2014,2013,2012,2011,2010,2009,2008,2007,2006,2005,2004,2003,2002,2001,2000,1999,1998,1997,1996,1995,1994,1993,1992,1991,1990,1989,1988,1987,1986,1985,1984,1983,1982,1981,1980
This statistics in other country:
AfghanistanAlbaniaAlgeriaAngolaAntigua and BarbudaArab WorldArgentinaArmeniaArubaAustraliaAustriaAzerbaijanBahamas, TheBahrainBangladeshBarbadosBelarusBelgiumBelizeBeninBermudaBhutanBoliviaBosnia and HerzegovinaBotswanaBrazilBrunei DarussalamBulgariaBurkina FasoBurundiCabo VerdeCambodiaCameroonCanadaCaribbean small statesCentral African RepublicCentral Europe and the BalticsChadChileChinaColombiaComorosCongo, Dem. Rep.Congo, Rep.Costa RicaCote d'IvoireCroatiaCubaCyprusCzech RepublicDenmarkDjiboutiDominicaDominican RepublicEarly-demographic dividendEast Asia & PacificEast Asia & Pacific (excluding high income)East Asia & Pacific (IDA & IBRD countries)EcuadorEgypt, Arab Rep.El SalvadorEquatorial GuineaEritreaEstoniaEthiopiaEuro areaEurope & Central AsiaEurope & Central Asia (excluding high income)Europe & Central Asia (IDA & IBRD countries)European UnionFaroe IslandsFijiFinlandFragile and conflict affected situationsFranceFrench PolynesiaGabonGambia, TheGeorgiaGermanyGhanaGreeceGreenlandGrenadaGuatemalaGuineaGuinea-BissauGuyanaHaitiHeavily indebted poor countries (HIPC)High incomeHondurasHong Kong SAR, ChinaHungaryIBRD onlyIcelandIDA & IBRD totalIDA blendIDA onlyIDA totalIndiaIndonesiaIran, Islamic Rep.IraqIrelandIsraelItalyJamaicaJapanJordanKazakhstanKenyaKiribatiKorea, Rep.KuwaitKyrgyz RepublicLao PDRLate-demographic dividendLatin America & Caribbean Latin America & Caribbean (excluding high income)Latin America & the Caribbean (IDA & IBRD countries)LatviaLeast developed countries: UN classificationLebanonLesothoLiberiaLibyaLithuaniaLow & middle incomeLow incomeLower middle incomeLuxembourgMacao SAR, ChinaMacedonia, FYRMadagascarMalawiMalaysiaMaldivesMaliMaltaMarshall IslandsMauritaniaMauritiusMexicoMicronesia, Fed. Sts.Middle East & North AfricaMiddle East & North Africa (excluding high income)Middle East & North Africa (IDA & IBRD countries)Middle incomeMoldovaMongoliaMontenegroMoroccoMozambiqueMyanmarNamibiaNepalNetherlandsNew CaledoniaNew ZealandNicaraguaNigerNigeriaNorth AmericaNorwayOECD membersOmanOther small statesPacific island small statesPakistanPalauPanamaPapua New GuineaParaguayPeruPhilippinesPolandPortugalPost-demographic dividendPre-demographic dividendQatarRomaniaRussian FederationRwandaSamoaSao Tome and PrincipeSaudi ArabiaSenegalSerbiaSeychellesSierra LeoneSingaporeSlovak RepublicSloveniaSmall statesSolomon IslandsSouth AfricaSouth AsiaSouth Asia (IDA & IBRD)SpainSri LankaSt. Kitts and NevisSt. LuciaSt. Vincent and the GrenadinesSub-Saharan Africa Sub-Saharan Africa (excluding high income)Sub-Saharan Africa (IDA & IBRD countries)SudanSurinameSwazilandSwedenSwitzerlandSyrian Arab RepublicTajikistanTanzaniaThailandTimor-LesteTogoTongaTrinidad and TobagoTunisiaTurkeyTurkmenistanTuvaluUgandaUkraineUnited Arab EmiratesUnited KingdomUnited StatesUpper middle incomeUruguayUzbekistanVanuatuVenezuela, RBVietnamWorldYemen, Rep.ZambiaZimbabwe Timeline:
This timeline shows a graph from 1980 to 2016 of St. Lucia. No data until 1979. Number of actual observations by date: 37.
Source name:
World Development Indicators
Source organization:
World Trade Organization, and World Bank GDP estimates.
Categories, topics:
Private Sector, Trade
Last updated:
apr 23, 2017
Indicators value changes by year
Minimum:
47.316
jan 1, 2003
Maximum:
136.417
jan 1, 1981
At the date of observation
Value
Absolute change
Change from previous value
jan 1, 1980
132.413
+132.413
0.0%
jan 1, 1981
136.417
+4.004
3.02%
jan 1, 1982
114.947
-21.47
-15.74%
jan 1, 1983
114.215
-0.732
-0.64%
jan 1, 1984
128.8
+14.585
12.77%
jan 1, 1985
85.241
-43.559
-33.82%
jan 1, 1986
96.211
+10.971
12.87%
jan 1, 1987
107.185
+10.974
11.41%
jan 1, 1988
106.442
-0.743
-0.69%
jan 1, 1989
122.273
+15.831
14.87%
jan 1, 1990
122.949
+0.676
0.55%
jan 1, 1991
100.203
-22.746
-18.5%
jan 1, 1992
93.865
-6.338
-6.33%
jan 1, 1993
91.214
-2.651
-2.82%
jan 1, 1994
85.361
-5.853
-6.42%
jan 1, 1995
79.024
-6.337
-7.42%
jan 1, 1996
74.178
-4.845
-6.13%
jan 1, 1997
69.389
-4.789
-6.46%
jan 1, 1998
65.022
-4.367
-6.29%
jan 1, 1999
59.343
-5.679
-8.73%
jan 1, 2000
59.306
-0.037
-0.06%
jan 1, 2001
50.967
-8.339
-14.06%
jan 1, 2002
53.746
+2.779
5.45%
jan 1, 2003
47.316
-6.43
-11.96%
jan 1, 2004
57.401
+10.085
21.31%
jan 1, 2005
56.285
-1.116
-1.94%
jan 1, 2006
58.097
+1.812
3.22%
jan 1, 2007
63.842
+5.745
9.89%
jan 1, 2008
61.877
-1.965
-3.08%
jan 1, 2009
69.057
+7.18
11.6%
jan 1, 2010
58.12
-10.937
-15.84%
jan 1, 2011
70.618
+12.499
21.51%
jan 1, 2012
66.916
-3.702
-5.24%
jan 1, 2013
63.599
-3.317
-4.96%
jan 1, 2014
60.302
-3.296
-5.18%
jan 1, 2015
56.839
-3.463
-5.74%
jan 1, 2016
52.965
-3.874
-6.82%
Ranking of countries by current statistics by years


Comments: