29
/
en
AIzaSyAYiBZKx7MnpbEhh9jyipgxe19OcubqV5w
April 1, 2024
123799
Ecuador
ECU
true
2
1
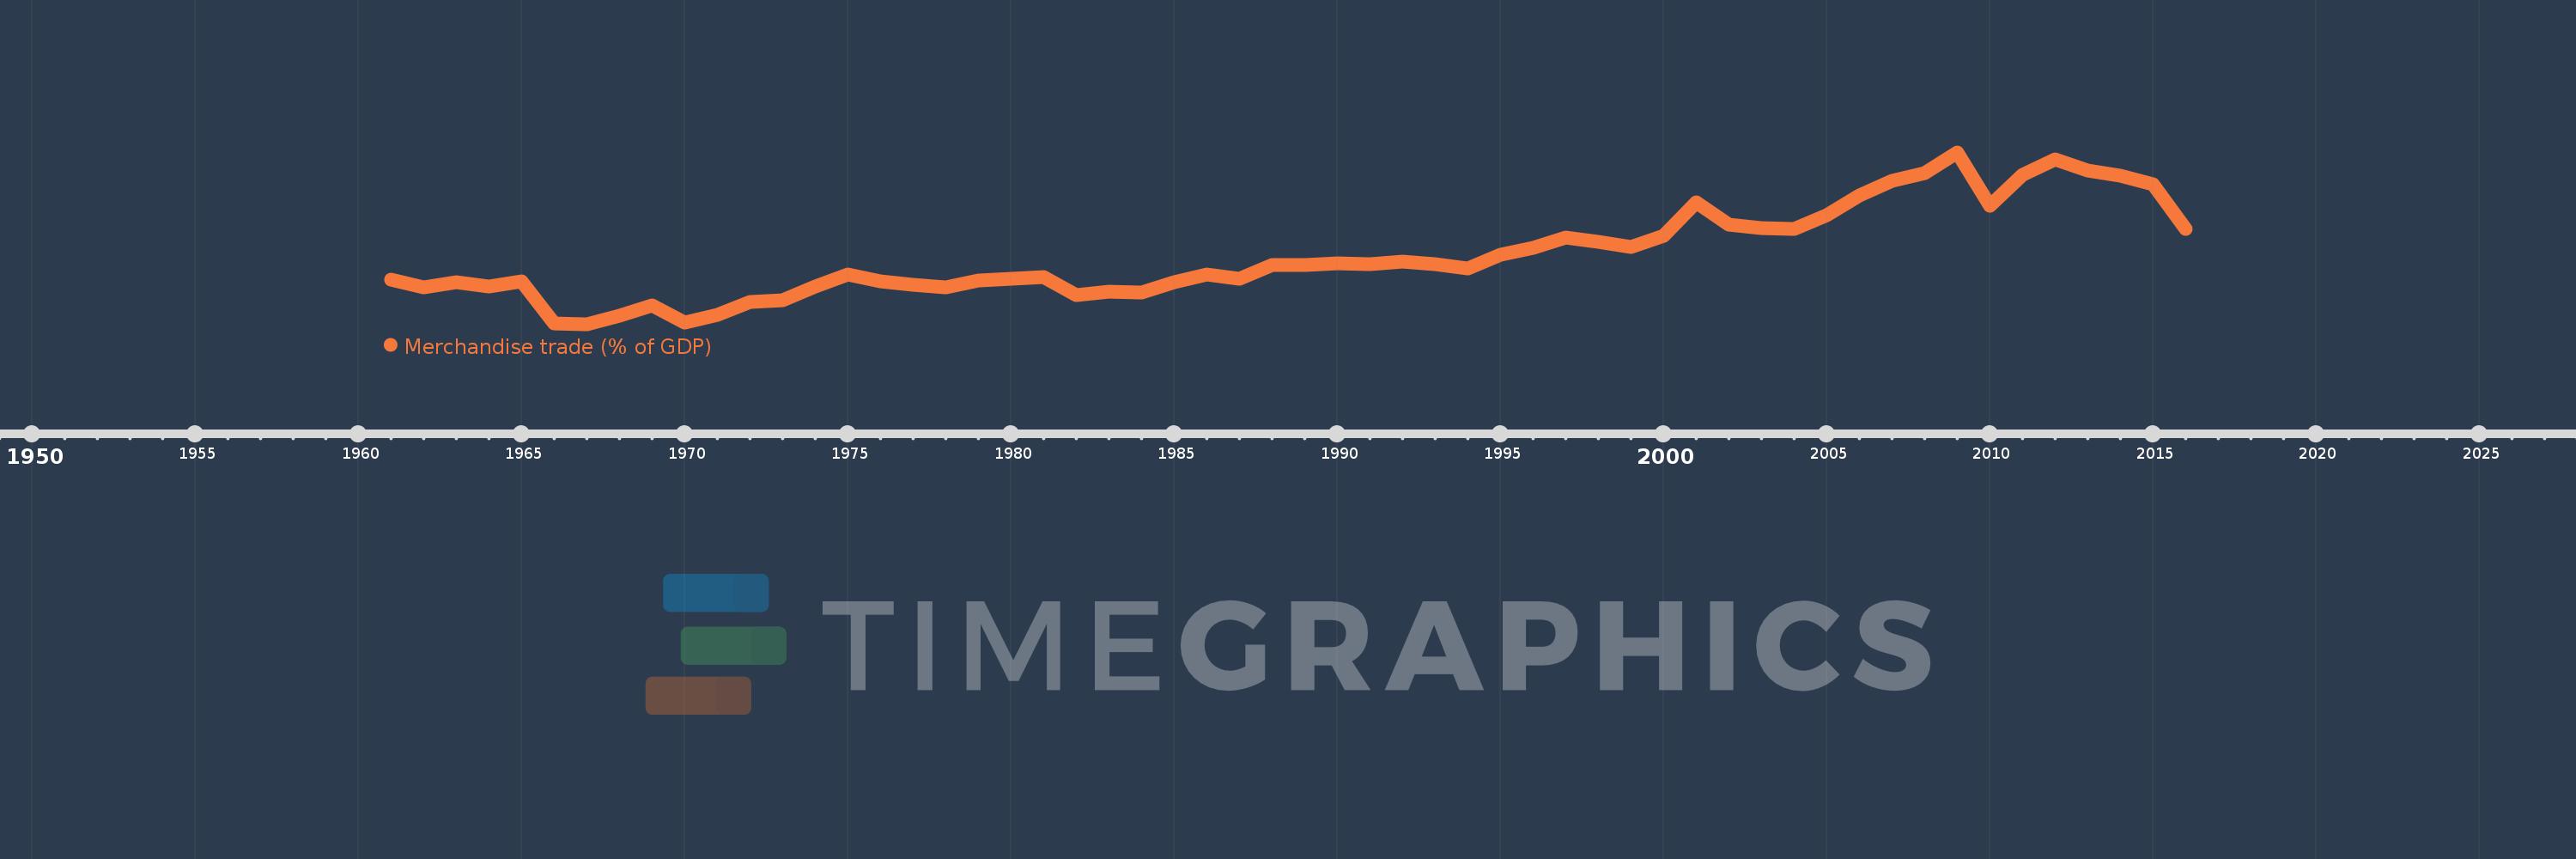
Merchandise trade (% of GDP)
2016,2015,2014,2013,2012,2011,2010,2009,2008,2007,2006,2005,2004,2003,2002,2001,2000,1999,1998,1997,1996,1995,1994,1993,1992,1991,1990,1989,1988,1987,1986,1985,1984,1983,1982,1981,1980,1979,1978,1977,1976,1975,1974,1973,1972,1971,1970,1969,1968,1967,1966,1965,1964,1963,1962,1961
This statistics in other country:
AfghanistanAlbaniaAlgeriaAngolaAntigua and BarbudaArab WorldArgentinaArmeniaArubaAustraliaAustriaAzerbaijanBahamas, TheBahrainBangladeshBarbadosBelarusBelgiumBelizeBeninBermudaBhutanBoliviaBosnia and HerzegovinaBotswanaBrazilBrunei DarussalamBulgariaBurkina FasoBurundiCabo VerdeCambodiaCameroonCanadaCaribbean small statesCentral African RepublicCentral Europe and the BalticsChadChileChinaColombiaComorosCongo, Dem. Rep.Congo, Rep.Costa RicaCote d'IvoireCroatiaCubaCyprusCzech RepublicDenmarkDjiboutiDominicaDominican RepublicEarly-demographic dividendEast Asia & PacificEast Asia & Pacific (excluding high income)East Asia & Pacific (IDA & IBRD countries)EcuadorEgypt, Arab Rep.El SalvadorEquatorial GuineaEritreaEstoniaEthiopiaEuro areaEurope & Central AsiaEurope & Central Asia (excluding high income)Europe & Central Asia (IDA & IBRD countries)European UnionFaroe IslandsFijiFinlandFragile and conflict affected situationsFranceFrench PolynesiaGabonGambia, TheGeorgiaGermanyGhanaGreeceGreenlandGrenadaGuatemalaGuineaGuinea-BissauGuyanaHaitiHeavily indebted poor countries (HIPC)High incomeHondurasHong Kong SAR, ChinaHungaryIBRD onlyIcelandIDA & IBRD totalIDA blendIDA onlyIDA totalIndiaIndonesiaIran, Islamic Rep.IraqIrelandIsraelItalyJamaicaJapanJordanKazakhstanKenyaKiribatiKorea, Rep.KuwaitKyrgyz RepublicLao PDRLate-demographic dividendLatin America & Caribbean Latin America & Caribbean (excluding high income)Latin America & the Caribbean (IDA & IBRD countries)LatviaLeast developed countries: UN classificationLebanonLesothoLiberiaLibyaLithuaniaLow & middle incomeLow incomeLower middle incomeLuxembourgMacao SAR, ChinaMacedonia, FYRMadagascarMalawiMalaysiaMaldivesMaliMaltaMarshall IslandsMauritaniaMauritiusMexicoMicronesia, Fed. Sts.Middle East & North AfricaMiddle East & North Africa (excluding high income)Middle East & North Africa (IDA & IBRD countries)Middle incomeMoldovaMongoliaMontenegroMoroccoMozambiqueMyanmarNamibiaNepalNetherlandsNew CaledoniaNew ZealandNicaraguaNigerNigeriaNorth AmericaNorwayOECD membersOmanOther small statesPacific island small statesPakistanPalauPanamaPapua New GuineaParaguayPeruPhilippinesPolandPortugalPost-demographic dividendPre-demographic dividendQatarRomaniaRussian FederationRwandaSamoaSao Tome and PrincipeSaudi ArabiaSenegalSerbiaSeychellesSierra LeoneSingaporeSlovak RepublicSloveniaSmall statesSolomon IslandsSouth AfricaSouth AsiaSouth Asia (IDA & IBRD)SpainSri LankaSt. Kitts and NevisSt. LuciaSt. Vincent and the GrenadinesSub-Saharan Africa Sub-Saharan Africa (excluding high income)Sub-Saharan Africa (IDA & IBRD countries)SudanSurinameSwazilandSwedenSwitzerlandSyrian Arab RepublicTajikistanTanzaniaThailandTimor-LesteTogoTongaTrinidad and TobagoTunisiaTurkeyTurkmenistanTuvaluUgandaUkraineUnited Arab EmiratesUnited KingdomUnited StatesUpper middle incomeUruguayUzbekistanVanuatuVenezuela, RBVietnamWorldYemen, Rep.ZambiaZimbabwe Timeline:
This timeline shows a graph from 1961 to 2016 of Ecuador. No data until 1960. Number of actual observations by date: 56.
Source name:
World Development Indicators
Source organization:
World Trade Organization, and World Bank GDP estimates.
Categories, topics:
Private Sector, Trade
Last updated:
apr 23, 2017
Indicators value changes by year
Minimum:
13.532
jan 1, 1967
Maximum:
60.992
jan 1, 2009
At the date of observation
Value
Absolute change
Change from previous value
jan 1, 1961
25.769
+25.769
0.0%
jan 1, 1962
23.747
-2.022
-7.85%
jan 1, 1963
25.187
+1.44
6.06%
jan 1, 1964
23.925
-1.262
-5.01%
jan 1, 1965
25.489
+1.564
6.54%
jan 1, 1966
13.807
-11.682
-45.83%
jan 1, 1967
13.532
-0.274
-1.99%
jan 1, 1968
15.815
+2.283
16.87%
jan 1, 1969
18.657
+2.841
17.97%
jan 1, 1970
13.971
-4.686
-25.12%
jan 1, 1971
16.201
+2.23
15.96%
jan 1, 1972
19.577
+3.376
20.84%
jan 1, 1973
20.242
+0.665
3.39%
jan 1, 1974
23.878
+3.636
17.96%
jan 1, 1975
27.302
+3.423
14.34%
jan 1, 1976
25.362
-1.939
-7.1%
jan 1, 1977
24.371
-0.991
-3.91%
jan 1, 1978
23.805
-0.567
-2.32%
jan 1, 1979
25.688
+1.883
7.91%
jan 1, 1980
26.129
+0.442
1.72%
jan 1, 1981
26.474
+0.345
1.32%
jan 1, 1982
21.535
-4.939
-18.66%
jan 1, 1983
22.559
+1.024
4.75%
jan 1, 1984
22.358
-0.201
-0.89%
jan 1, 1985
25.047
+2.688
12.02%
jan 1, 1986
27.243
+2.197
8.77%
jan 1, 1987
26.002
-1.241
-4.56%
jan 1, 1988
29.974
+3.972
15.28%
jan 1, 1989
29.927
-0.047
-0.16%
jan 1, 1990
30.301
+0.374
1.25%
jan 1, 1991
30.021
-0.279
-0.92%
jan 1, 1992
30.909
+0.888
2.96%
jan 1, 1993
30.054
-0.855
-2.77%
jan 1, 1994
28.856
-1.198
-3.98%
jan 1, 1995
32.767
+3.911
13.55%
jan 1, 1996
34.621
+1.854
5.66%
jan 1, 1997
37.589
+2.967
8.57%
jan 1, 1998
36.283
-1.306
-3.47%
jan 1, 1999
34.948
-1.335
-3.68%
jan 1, 2000
38.014
+3.067
8.77%
jan 1, 2001
47.185
+9.171
24.13%
jan 1, 2002
41.037
-6.149
-13.03%
jan 1, 2003
40.187
-0.85
-2.07%
jan 1, 2004
39.853
-0.334
-0.83%
jan 1, 2005
43.669
+3.816
9.58%
jan 1, 2006
49.117
+5.448
12.48%
jan 1, 2007
53.078
+3.961
8.07%
jan 1, 2008
55.314
+2.236
4.21%
jan 1, 2009
60.992
+5.678
10.26%
jan 1, 2010
46.31
-14.682
-24.07%
jan 1, 2011
54.749
+8.439
18.22%
jan 1, 2012
58.983
+4.234
7.73%
jan 1, 2013
56.005
-2.979
-5.05%
jan 1, 2014
54.656
-1.349
-2.41%
jan 1, 2015
52.253
-2.403
-4.4%
jan 1, 2016
39.778
-12.475
-23.87%
Ranking of countries by current statistics by years


Comments: