29
/
en
AIzaSyAYiBZKx7MnpbEhh9jyipgxe19OcubqV5w
April 1, 2024
262555
Thailand
THA
true
2
1
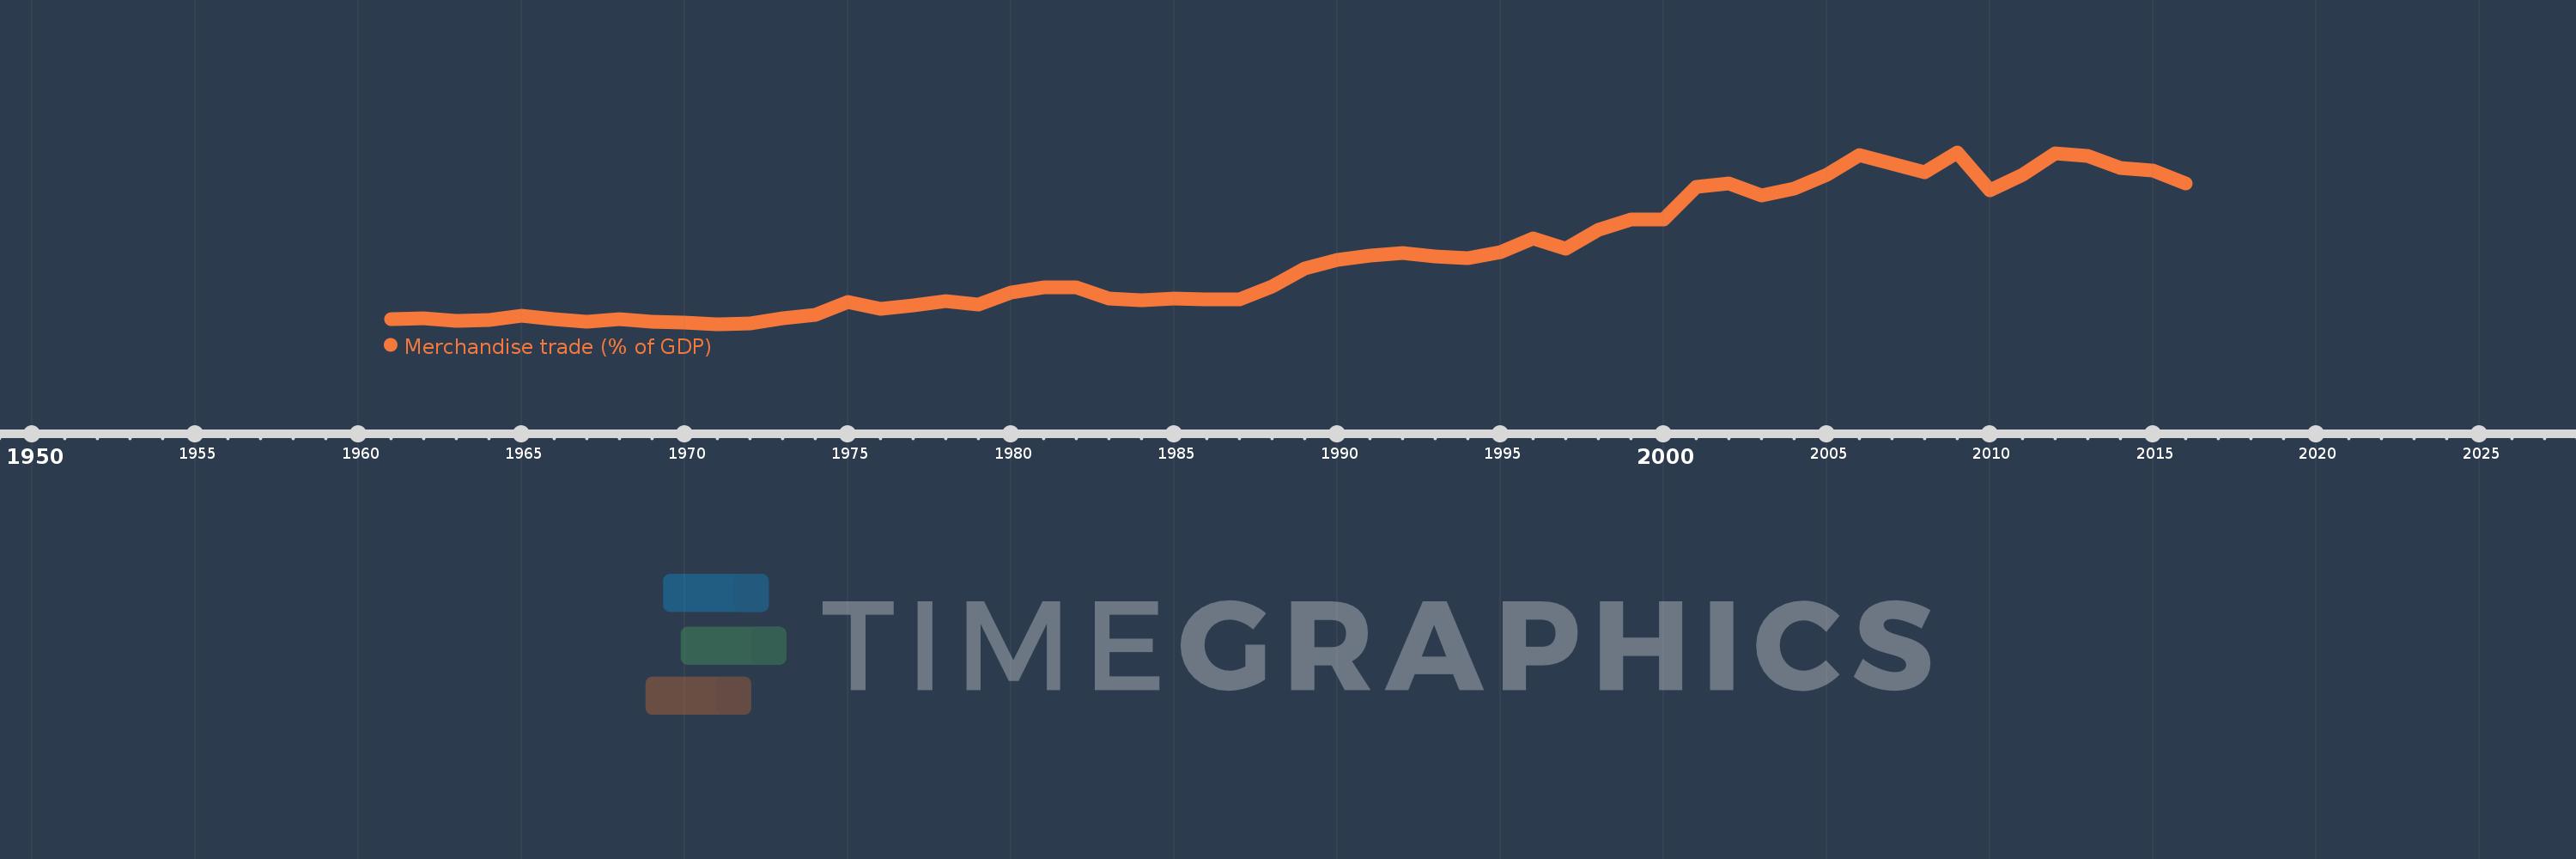
Merchandise trade (% of GDP)
2016,2015,2014,2013,2012,2011,2010,2009,2008,2007,2006,2005,2004,2003,2002,2001,2000,1999,1998,1997,1996,1995,1994,1993,1992,1991,1990,1989,1988,1987,1986,1985,1984,1983,1982,1981,1980,1979,1978,1977,1976,1975,1974,1973,1972,1971,1970,1969,1968,1967,1966,1965,1964,1963,1962,1961
This statistics in other country:
AfghanistanAlbaniaAlgeriaAngolaAntigua and BarbudaArab WorldArgentinaArmeniaArubaAustraliaAustriaAzerbaijanBahamas, TheBahrainBangladeshBarbadosBelarusBelgiumBelizeBeninBermudaBhutanBoliviaBosnia and HerzegovinaBotswanaBrazilBrunei DarussalamBulgariaBurkina FasoBurundiCabo VerdeCambodiaCameroonCanadaCaribbean small statesCentral African RepublicCentral Europe and the BalticsChadChileChinaColombiaComorosCongo, Dem. Rep.Congo, Rep.Costa RicaCote d'IvoireCroatiaCubaCyprusCzech RepublicDenmarkDjiboutiDominicaDominican RepublicEarly-demographic dividendEast Asia & PacificEast Asia & Pacific (excluding high income)East Asia & Pacific (IDA & IBRD countries)EcuadorEgypt, Arab Rep.El SalvadorEquatorial GuineaEritreaEstoniaEthiopiaEuro areaEurope & Central AsiaEurope & Central Asia (excluding high income)Europe & Central Asia (IDA & IBRD countries)European UnionFaroe IslandsFijiFinlandFragile and conflict affected situationsFranceFrench PolynesiaGabonGambia, TheGeorgiaGermanyGhanaGreeceGreenlandGrenadaGuatemalaGuineaGuinea-BissauGuyanaHaitiHeavily indebted poor countries (HIPC)High incomeHondurasHong Kong SAR, ChinaHungaryIBRD onlyIcelandIDA & IBRD totalIDA blendIDA onlyIDA totalIndiaIndonesiaIran, Islamic Rep.IraqIrelandIsraelItalyJamaicaJapanJordanKazakhstanKenyaKiribatiKorea, Rep.KuwaitKyrgyz RepublicLao PDRLate-demographic dividendLatin America & Caribbean Latin America & Caribbean (excluding high income)Latin America & the Caribbean (IDA & IBRD countries)LatviaLeast developed countries: UN classificationLebanonLesothoLiberiaLibyaLithuaniaLow & middle incomeLow incomeLower middle incomeLuxembourgMacao SAR, ChinaMacedonia, FYRMadagascarMalawiMalaysiaMaldivesMaliMaltaMarshall IslandsMauritaniaMauritiusMexicoMicronesia, Fed. Sts.Middle East & North AfricaMiddle East & North Africa (excluding high income)Middle East & North Africa (IDA & IBRD countries)Middle incomeMoldovaMongoliaMontenegroMoroccoMozambiqueMyanmarNamibiaNepalNetherlandsNew CaledoniaNew ZealandNicaraguaNigerNigeriaNorth AmericaNorwayOECD membersOmanOther small statesPacific island small statesPakistanPalauPanamaPapua New GuineaParaguayPeruPhilippinesPolandPortugalPost-demographic dividendPre-demographic dividendQatarRomaniaRussian FederationRwandaSamoaSao Tome and PrincipeSaudi ArabiaSenegalSerbiaSeychellesSierra LeoneSingaporeSlovak RepublicSloveniaSmall statesSolomon IslandsSouth AfricaSouth AsiaSouth Asia (IDA & IBRD)SpainSri LankaSt. Kitts and NevisSt. LuciaSt. Vincent and the GrenadinesSub-Saharan Africa Sub-Saharan Africa (excluding high income)Sub-Saharan Africa (IDA & IBRD countries)SudanSurinameSwazilandSwedenSwitzerlandSyrian Arab RepublicTajikistanTanzaniaThailandTimor-LesteTogoTongaTrinidad and TobagoTunisiaTurkeyTurkmenistanTuvaluUgandaUkraineUnited Arab EmiratesUnited KingdomUnited StatesUpper middle incomeUruguayUzbekistanVanuatuVenezuela, RBVietnamWorldYemen, Rep.ZambiaZimbabwe Timeline:
This timeline shows a graph from 1961 to 2016 of Thailand. No data until 1960. Number of actual observations by date: 56.
Source name:
World Development Indicators
Source organization:
World Trade Organization, and World Bank GDP estimates.
Categories, topics:
Private Sector, Trade
Last updated:
apr 23, 2017
Indicators value changes by year
Minimum:
28.345
jan 1, 1971
Maximum:
122.52
jan 1, 2009
At the date of observation
Value
Absolute change
Change from previous value
jan 1, 1961
31.079
+31.079
0.0%
jan 1, 1962
31.707
+0.628
2.02%
jan 1, 1963
30.342
-1.365
-4.3%
jan 1, 1964
30.646
+0.304
1.0%
jan 1, 1965
32.873
+2.226
7.27%
jan 1, 1966
31.081
-1.791
-5.45%
jan 1, 1967
29.691
-1.39
-4.47%
jan 1, 1968
30.998
+1.307
4.4%
jan 1, 1969
29.871
-1.127
-3.64%
jan 1, 1970
29.207
-0.663
-2.22%
jan 1, 1971
28.345
-0.862
-2.95%
jan 1, 1972
28.728
+0.383
1.35%
jan 1, 1973
31.373
+2.645
9.21%
jan 1, 1974
33.331
+1.958
6.24%
jan 1, 1975
40.775
+7.443
22.33%
jan 1, 1976
36.875
-3.899
-9.56%
jan 1, 1977
38.578
+1.703
4.62%
jan 1, 1978
40.985
+2.407
6.24%
jan 1, 1979
39.328
-1.657
-4.04%
jan 1, 1980
45.506
+6.178
15.71%
jan 1, 1981
48.585
+3.079
6.77%
jan 1, 1982
48.746
+0.161
0.33%
jan 1, 1983
42.345
-6.401
-13.13%
jan 1, 1984
41.593
-0.752
-1.78%
jan 1, 1985
42.613
+1.02
2.45%
jan 1, 1986
42.064
-0.549
-1.29%
jan 1, 1987
41.871
-0.193
-0.46%
jan 1, 1988
48.831
+6.96
16.62%
jan 1, 1989
58.764
+9.933
20.34%
jan 1, 1990
63.458
+4.694
7.99%
jan 1, 1991
65.75
+2.292
3.61%
jan 1, 1992
67.183
+1.433
2.18%
jan 1, 1993
65.64
-1.543
-2.3%
jan 1, 1994
64.432
-1.209
-1.84%
jan 1, 1995
67.983
+3.551
5.51%
jan 1, 1996
75.157
+7.174
10.55%
jan 1, 1997
69.961
-5.196
-6.91%
jan 1, 1998
80.056
+10.095
14.43%
jan 1, 1999
85.706
+5.65
7.06%
jan 1, 2000
85.879
+0.173
0.2%
jan 1, 2001
103.631
+17.752
20.67%
jan 1, 2002
105.514
+1.884
1.82%
jan 1, 2003
98.847
-6.667
-6.32%
jan 1, 2004
102.54
+3.692
3.74%
jan 1, 2005
110.274
+7.734
7.54%
jan 1, 2006
121.02
+10.747
9.75%
jan 1, 2007
116.566
-4.454
-3.68%
jan 1, 2008
111.748
-4.818
-4.13%
jan 1, 2009
122.52
+10.772
9.64%
jan 1, 2010
101.618
-20.902
-17.06%
jan 1, 2011
110.355
+8.737
8.6%
jan 1, 2012
121.79
+11.434
10.36%
jan 1, 2013
120.37
-1.419
-1.17%
jan 1, 2014
114.057
-6.314
-5.25%
jan 1, 2015
112.602
-1.455
-1.28%
jan 1, 2016
105.532
-7.07
-6.28%
Ranking of countries by current statistics by years


Comments: