29
/
en
AIzaSyAYiBZKx7MnpbEhh9jyipgxe19OcubqV5w
April 1, 2024
240700
Singapore
SGP
true
2
1
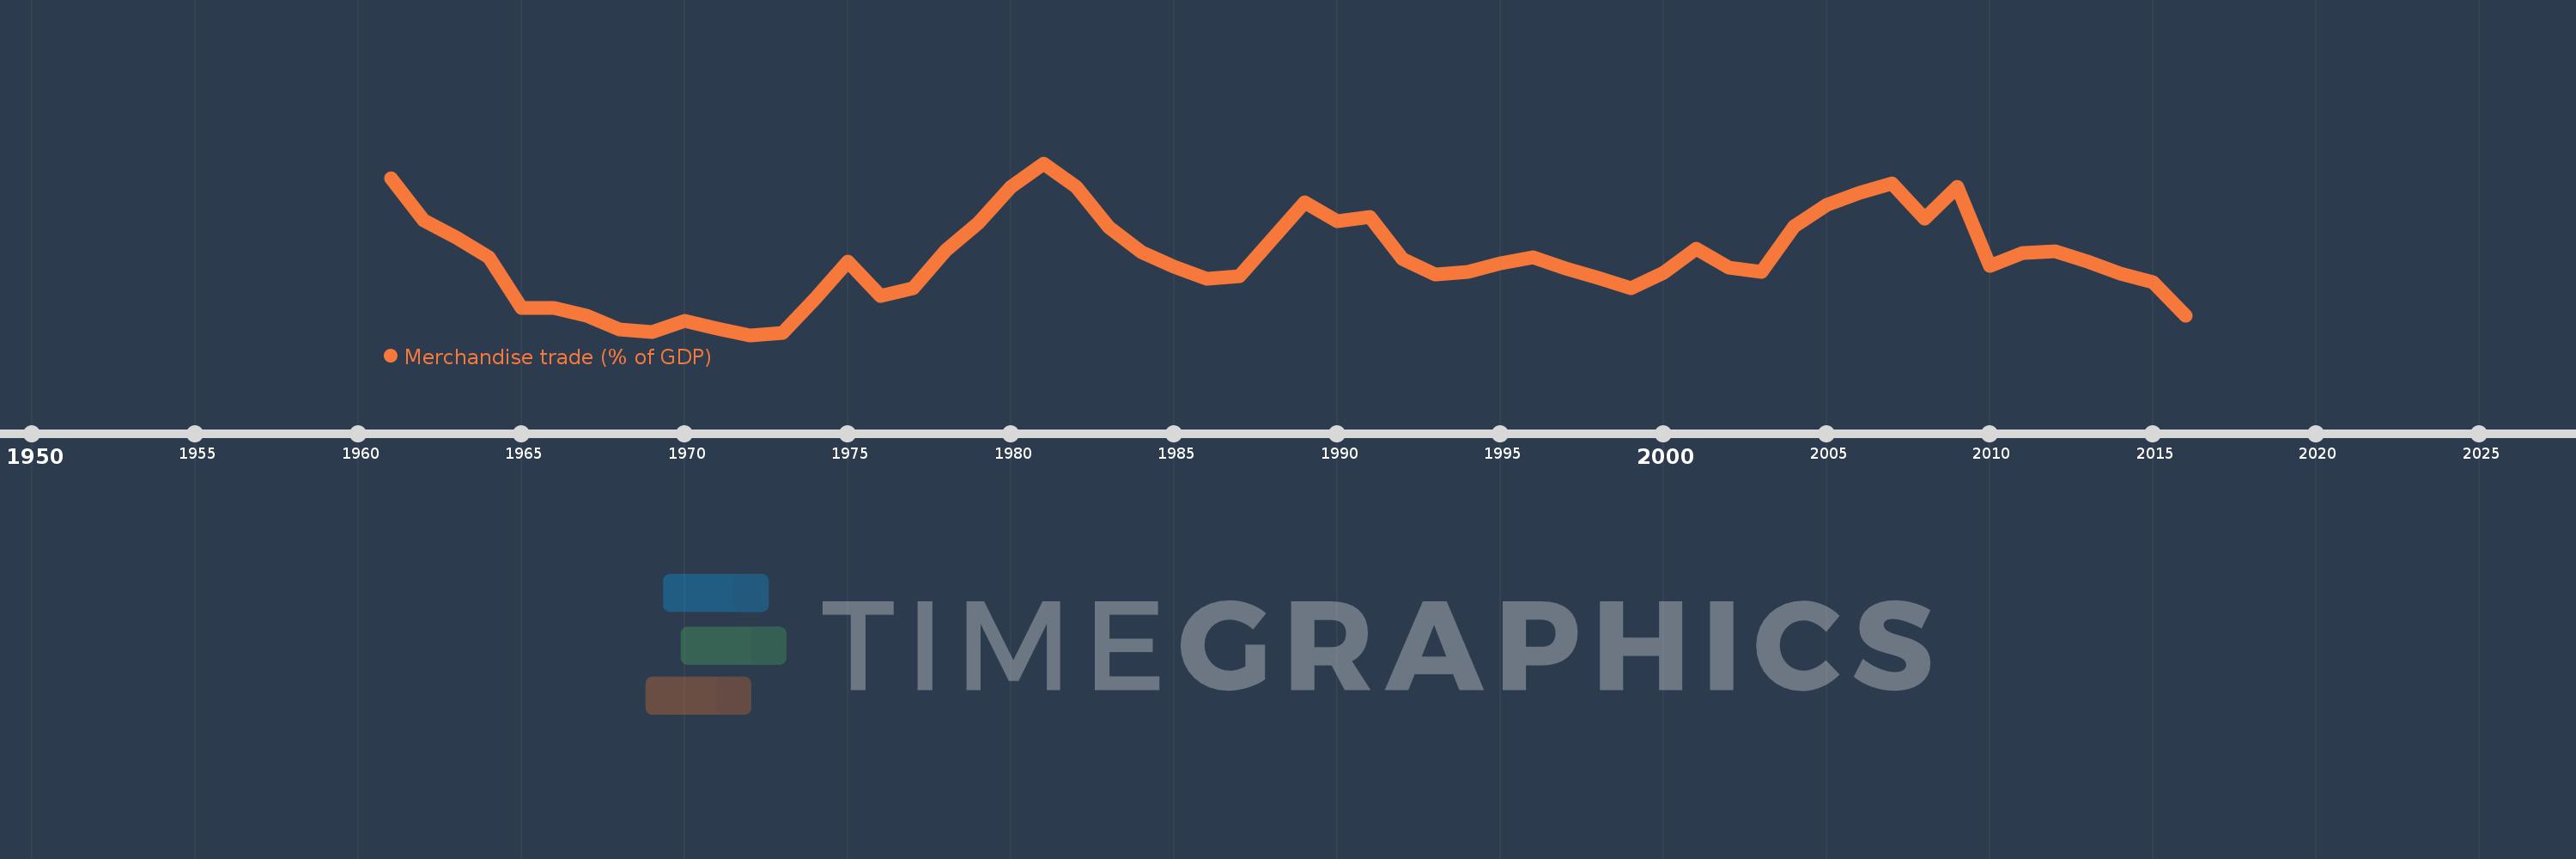
Merchandise trade (% of GDP)
2016,2015,2014,2013,2012,2011,2010,2009,2008,2007,2006,2005,2004,2003,2002,2001,2000,1999,1998,1997,1996,1995,1994,1993,1992,1991,1990,1989,1988,1987,1986,1985,1984,1983,1982,1981,1980,1979,1978,1977,1976,1975,1974,1973,1972,1971,1970,1969,1968,1967,1966,1965,1964,1963,1962,1961
This statistics in other country:
AfghanistanAlbaniaAlgeriaAngolaAntigua and BarbudaArab WorldArgentinaArmeniaArubaAustraliaAustriaAzerbaijanBahamas, TheBahrainBangladeshBarbadosBelarusBelgiumBelizeBeninBermudaBhutanBoliviaBosnia and HerzegovinaBotswanaBrazilBrunei DarussalamBulgariaBurkina FasoBurundiCabo VerdeCambodiaCameroonCanadaCaribbean small statesCentral African RepublicCentral Europe and the BalticsChadChileChinaColombiaComorosCongo, Dem. Rep.Congo, Rep.Costa RicaCote d'IvoireCroatiaCubaCyprusCzech RepublicDenmarkDjiboutiDominicaDominican RepublicEarly-demographic dividendEast Asia & PacificEast Asia & Pacific (excluding high income)East Asia & Pacific (IDA & IBRD countries)EcuadorEgypt, Arab Rep.El SalvadorEquatorial GuineaEritreaEstoniaEthiopiaEuro areaEurope & Central AsiaEurope & Central Asia (excluding high income)Europe & Central Asia (IDA & IBRD countries)European UnionFaroe IslandsFijiFinlandFragile and conflict affected situationsFranceFrench PolynesiaGabonGambia, TheGeorgiaGermanyGhanaGreeceGreenlandGrenadaGuatemalaGuineaGuinea-BissauGuyanaHaitiHeavily indebted poor countries (HIPC)High incomeHondurasHong Kong SAR, ChinaHungaryIBRD onlyIcelandIDA & IBRD totalIDA blendIDA onlyIDA totalIndiaIndonesiaIran, Islamic Rep.IraqIrelandIsraelItalyJamaicaJapanJordanKazakhstanKenyaKiribatiKorea, Rep.KuwaitKyrgyz RepublicLao PDRLate-demographic dividendLatin America & Caribbean Latin America & Caribbean (excluding high income)Latin America & the Caribbean (IDA & IBRD countries)LatviaLeast developed countries: UN classificationLebanonLesothoLiberiaLibyaLithuaniaLow & middle incomeLow incomeLower middle incomeLuxembourgMacao SAR, ChinaMacedonia, FYRMadagascarMalawiMalaysiaMaldivesMaliMaltaMarshall IslandsMauritaniaMauritiusMexicoMicronesia, Fed. Sts.Middle East & North AfricaMiddle East & North Africa (excluding high income)Middle East & North Africa (IDA & IBRD countries)Middle incomeMoldovaMongoliaMontenegroMoroccoMozambiqueMyanmarNamibiaNepalNetherlandsNew CaledoniaNew ZealandNicaraguaNigerNigeriaNorth AmericaNorwayOECD membersOmanOther small statesPacific island small statesPakistanPalauPanamaPapua New GuineaParaguayPeruPhilippinesPolandPortugalPost-demographic dividendPre-demographic dividendQatarRomaniaRussian FederationRwandaSamoaSao Tome and PrincipeSaudi ArabiaSenegalSerbiaSeychellesSierra LeoneSingaporeSlovak RepublicSloveniaSmall statesSolomon IslandsSouth AfricaSouth AsiaSouth Asia (IDA & IBRD)SpainSri LankaSt. Kitts and NevisSt. LuciaSt. Vincent and the GrenadinesSub-Saharan Africa Sub-Saharan Africa (excluding high income)Sub-Saharan Africa (IDA & IBRD countries)SudanSurinameSwazilandSwedenSwitzerlandSyrian Arab RepublicTajikistanTanzaniaThailandTimor-LesteTogoTongaTrinidad and TobagoTunisiaTurkeyTurkmenistanTuvaluUgandaUkraineUnited Arab EmiratesUnited KingdomUnited StatesUpper middle incomeUruguayUzbekistanVanuatuVenezuela, RBVietnamWorldYemen, Rep.ZambiaZimbabwe Timeline:
This timeline shows a graph from 1961 to 2016 of Singapore. No data until 1960. Number of actual observations by date: 56.
Source name:
World Development Indicators
Source organization:
World Trade Organization, and World Bank GDP estimates.
Categories, topics:
Private Sector, Trade
Last updated:
apr 23, 2017
Indicators value changes by year
Minimum:
203.286
jan 1, 1972
Maximum:
364.765
jan 1, 1981
At the date of observation
Value
Absolute change
Change from previous value
jan 1, 1961
350.426
+350.426
0.0%
jan 1, 1962
310.893
-39.533
-11.28%
jan 1, 1963
294.833
-16.06
-5.17%
jan 1, 1964
276.194
-18.639
-6.32%
jan 1, 1965
228.515
-47.678
-17.26%
jan 1, 1966
228.354
-0.162
-0.07%
jan 1, 1967
221.74
-6.614
-2.9%
jan 1, 1968
208.474
-13.266
-5.98%
jan 1, 1969
205.716
-2.758
-1.32%
jan 1, 1970
216.274
+10.559
5.13%
jan 1, 1971
209.172
-7.103
-3.28%
jan 1, 1972
203.286
-5.886
-2.81%
jan 1, 1973
205.292
+2.006
0.99%
jan 1, 1974
237.686
+32.394
15.78%
jan 1, 1975
272.0
+34.314
14.44%
jan 1, 1976
239.808
-32.192
-11.84%
jan 1, 1977
247.471
+7.663
3.2%
jan 1, 1978
282.76
+35.29
14.26%
jan 1, 1979
308.617
+25.857
9.14%
jan 1, 1980
342.957
+34.34
11.13%
jan 1, 1981
364.765
+21.808
6.36%
jan 1, 1982
342.504
-22.262
-6.1%
jan 1, 1983
304.462
-38.042
-11.11%
jan 1, 1984
281.239
-23.223
-7.63%
jan 1, 1985
267.213
-14.026
-4.99%
jan 1, 1986
256.538
-10.675
-4.0%
jan 1, 1987
258.524
+1.986
0.77%
jan 1, 1988
293.076
+34.553
13.37%
jan 1, 1989
328.252
+35.176
12.0%
jan 1, 1990
310.062
-18.19
-5.54%
jan 1, 1991
313.963
+3.901
1.26%
jan 1, 1992
275.014
-38.949
-12.41%
jan 1, 1993
260.07
-14.944
-5.43%
jan 1, 1994
262.589
+2.519
0.97%
jan 1, 1995
270.4
+7.811
2.97%
jan 1, 1996
276.226
+5.826
2.15%
jan 1, 1997
265.915
-10.311
-3.73%
jan 1, 1998
257.001
-8.914
-3.35%
jan 1, 1999
246.917
-10.083
-3.92%
jan 1, 2000
261.627
+14.71
5.96%
jan 1, 2001
284.188
+22.561
8.62%
jan 1, 2002
266.28
-17.909
-6.3%
jan 1, 2003
262.796
-3.483
-1.31%
jan 1, 2004
305.274
+42.478
16.16%
jan 1, 2005
325.984
+20.71
6.78%
jan 1, 2006
337.234
+11.251
3.45%
jan 1, 2007
345.417
+8.183
2.43%
jan 1, 2008
312.512
-32.905
-9.53%
jan 1, 2009
342.283
+29.771
9.53%
jan 1, 2010
267.981
-74.302
-21.71%
jan 1, 2011
280.286
+12.306
4.59%
jan 1, 2012
281.691
+1.405
0.5%
jan 1, 2013
272.451
-9.24
-3.28%
jan 1, 2014
260.838
-11.614
-4.26%
jan 1, 2015
253.321
-7.517
-2.88%
jan 1, 2016
221.101
-32.219
-12.72%
Ranking of countries by current statistics by years


Comments: