29
/
en
AIzaSyAYiBZKx7MnpbEhh9jyipgxe19OcubqV5w
April 1, 2024
132267
Fiji
FJI
true
2
1
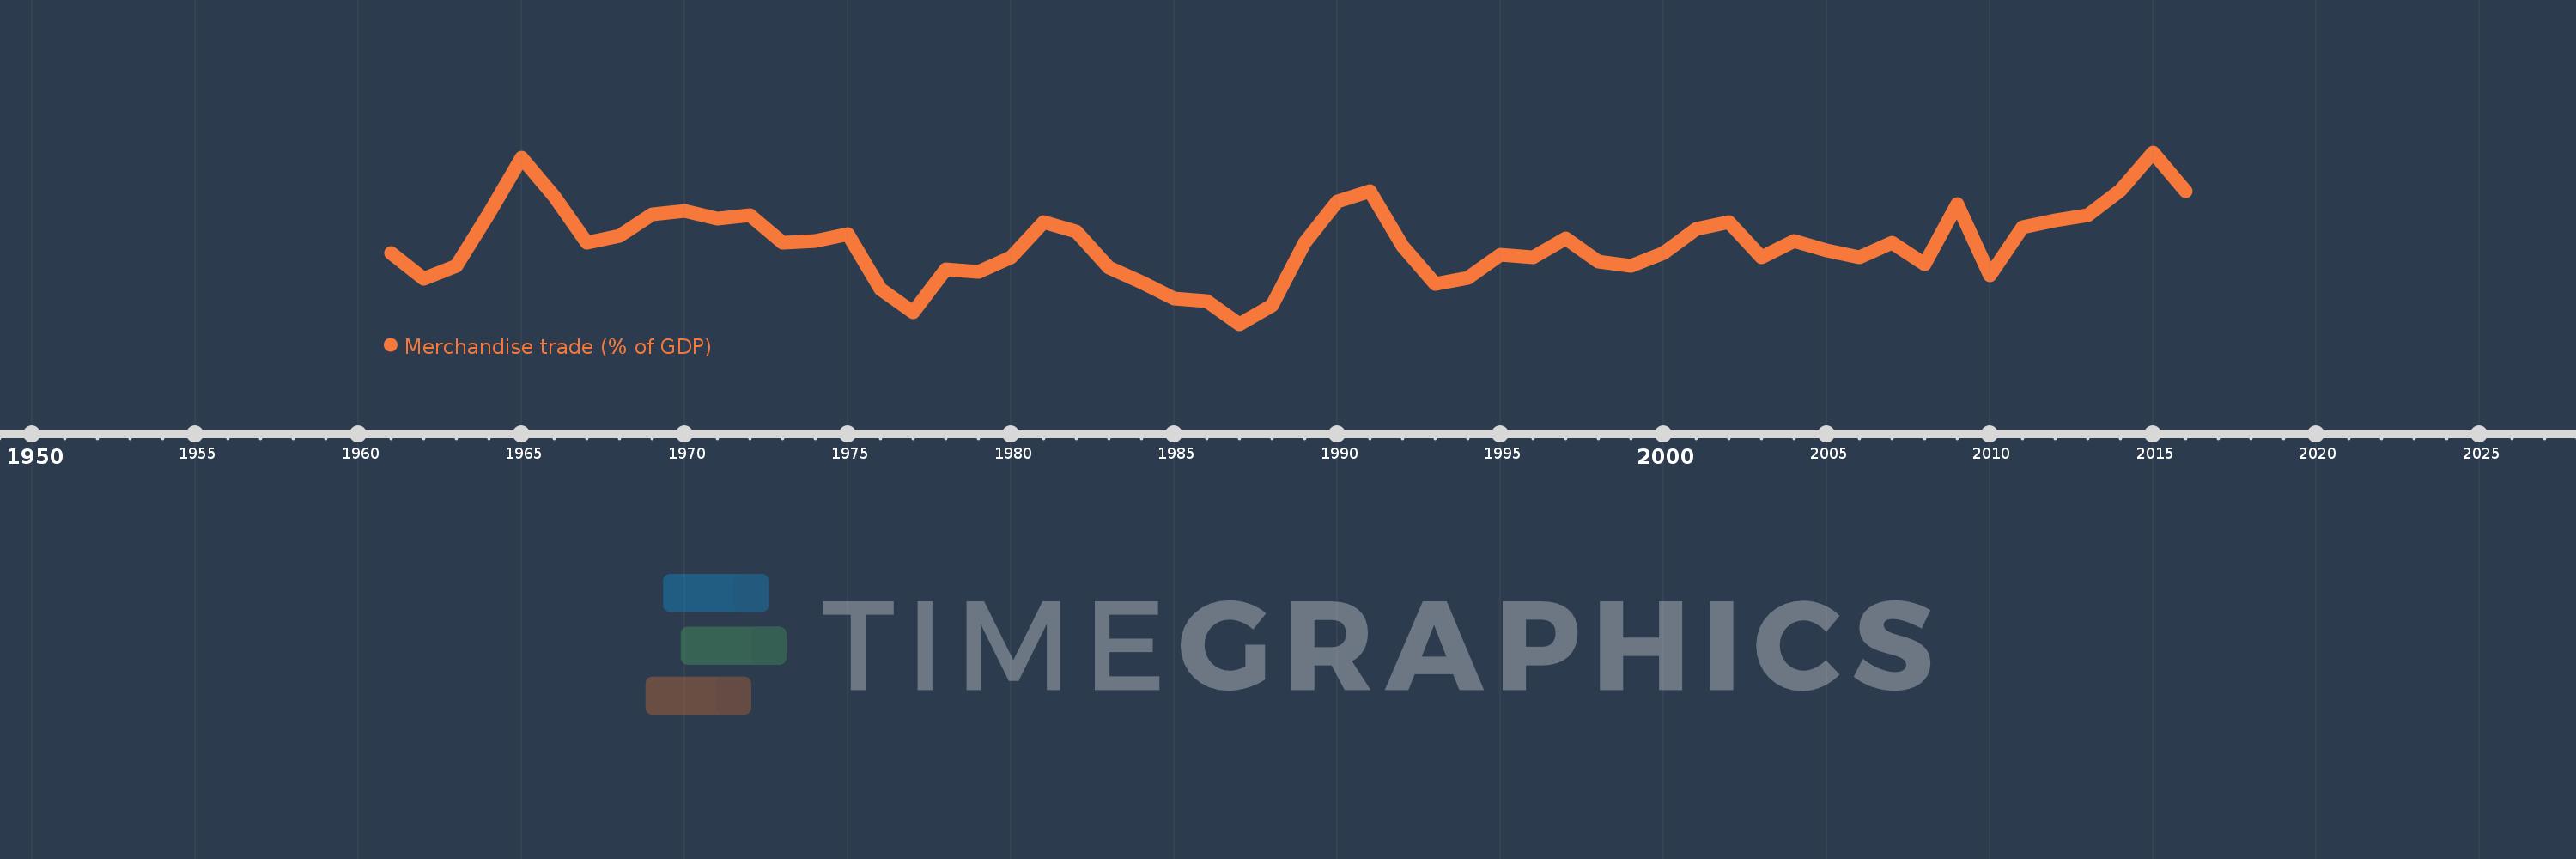
Merchandise trade (% of GDP)
2016,2015,2014,2013,2012,2011,2010,2009,2008,2007,2006,2005,2004,2003,2002,2001,2000,1999,1998,1997,1996,1995,1994,1993,1992,1991,1990,1989,1988,1987,1986,1985,1984,1983,1982,1981,1980,1979,1978,1977,1976,1975,1974,1973,1972,1971,1970,1969,1968,1967,1966,1965,1964,1963,1962,1961
This statistics in other country:
AfghanistanAlbaniaAlgeriaAngolaAntigua and BarbudaArab WorldArgentinaArmeniaArubaAustraliaAustriaAzerbaijanBahamas, TheBahrainBangladeshBarbadosBelarusBelgiumBelizeBeninBermudaBhutanBoliviaBosnia and HerzegovinaBotswanaBrazilBrunei DarussalamBulgariaBurkina FasoBurundiCabo VerdeCambodiaCameroonCanadaCaribbean small statesCentral African RepublicCentral Europe and the BalticsChadChileChinaColombiaComorosCongo, Dem. Rep.Congo, Rep.Costa RicaCote d'IvoireCroatiaCubaCyprusCzech RepublicDenmarkDjiboutiDominicaDominican RepublicEarly-demographic dividendEast Asia & PacificEast Asia & Pacific (excluding high income)East Asia & Pacific (IDA & IBRD countries)EcuadorEgypt, Arab Rep.El SalvadorEquatorial GuineaEritreaEstoniaEthiopiaEuro areaEurope & Central AsiaEurope & Central Asia (excluding high income)Europe & Central Asia (IDA & IBRD countries)European UnionFaroe IslandsFijiFinlandFragile and conflict affected situationsFranceFrench PolynesiaGabonGambia, TheGeorgiaGermanyGhanaGreeceGreenlandGrenadaGuatemalaGuineaGuinea-BissauGuyanaHaitiHeavily indebted poor countries (HIPC)High incomeHondurasHong Kong SAR, ChinaHungaryIBRD onlyIcelandIDA & IBRD totalIDA blendIDA onlyIDA totalIndiaIndonesiaIran, Islamic Rep.IraqIrelandIsraelItalyJamaicaJapanJordanKazakhstanKenyaKiribatiKorea, Rep.KuwaitKyrgyz RepublicLao PDRLate-demographic dividendLatin America & Caribbean Latin America & Caribbean (excluding high income)Latin America & the Caribbean (IDA & IBRD countries)LatviaLeast developed countries: UN classificationLebanonLesothoLiberiaLibyaLithuaniaLow & middle incomeLow incomeLower middle incomeLuxembourgMacao SAR, ChinaMacedonia, FYRMadagascarMalawiMalaysiaMaldivesMaliMaltaMarshall IslandsMauritaniaMauritiusMexicoMicronesia, Fed. Sts.Middle East & North AfricaMiddle East & North Africa (excluding high income)Middle East & North Africa (IDA & IBRD countries)Middle incomeMoldovaMongoliaMontenegroMoroccoMozambiqueMyanmarNamibiaNepalNetherlandsNew CaledoniaNew ZealandNicaraguaNigerNigeriaNorth AmericaNorwayOECD membersOmanOther small statesPacific island small statesPakistanPalauPanamaPapua New GuineaParaguayPeruPhilippinesPolandPortugalPost-demographic dividendPre-demographic dividendQatarRomaniaRussian FederationRwandaSamoaSao Tome and PrincipeSaudi ArabiaSenegalSerbiaSeychellesSierra LeoneSingaporeSlovak RepublicSloveniaSmall statesSolomon IslandsSouth AfricaSouth AsiaSouth Asia (IDA & IBRD)SpainSri LankaSt. Kitts and NevisSt. LuciaSt. Vincent and the GrenadinesSub-Saharan Africa Sub-Saharan Africa (excluding high income)Sub-Saharan Africa (IDA & IBRD countries)SudanSurinameSwazilandSwedenSwitzerlandSyrian Arab RepublicTajikistanTanzaniaThailandTimor-LesteTogoTongaTrinidad and TobagoTunisiaTurkeyTurkmenistanTuvaluUgandaUkraineUnited Arab EmiratesUnited KingdomUnited StatesUpper middle incomeUruguayUzbekistanVanuatuVenezuela, RBVietnamWorldYemen, Rep.ZambiaZimbabwe Timeline:
This timeline shows a graph from 1961 to 2016 of Fiji. No data until 1960. Number of actual observations by date: 56.
Source name:
World Development Indicators
Source organization:
World Trade Organization, and World Bank GDP estimates.
Categories, topics:
Private Sector, Trade
Last updated:
apr 23, 2017
Indicators value changes by year
Minimum:
59.757
jan 1, 1987
Maximum:
103.443
jan 1, 2015
At the date of observation
Value
Absolute change
Change from previous value
jan 1, 1961
77.823
+77.823
0.0%
jan 1, 1962
71.257
-6.567
-8.44%
jan 1, 1963
74.672
+3.415
4.79%
jan 1, 1964
87.968
+13.296
17.81%
jan 1, 1965
102.199
+14.231
16.18%
jan 1, 1966
92.22
-9.98
-9.76%
jan 1, 1967
80.489
-11.731
-12.72%
jan 1, 1968
82.273
+1.784
2.22%
jan 1, 1969
87.615
+5.342
6.49%
jan 1, 1970
88.508
+0.893
1.02%
jan 1, 1971
86.633
-1.875
-2.12%
jan 1, 1972
87.46
+0.827
0.95%
jan 1, 1973
80.4
-7.06
-8.07%
jan 1, 1974
80.825
+0.425
0.53%
jan 1, 1975
82.746
+1.922
2.38%
jan 1, 1976
68.79
-13.957
-16.87%
jan 1, 1977
62.784
-6.005
-8.73%
jan 1, 1978
73.74
+10.956
17.45%
jan 1, 1979
73.142
-0.598
-0.81%
jan 1, 1980
76.844
+3.702
5.06%
jan 1, 1981
85.816
+8.972
11.68%
jan 1, 1982
83.421
-2.395
-2.79%
jan 1, 1983
74.203
-9.218
-11.05%
jan 1, 1984
70.341
-3.863
-5.21%
jan 1, 1985
66.384
-3.957
-5.63%
jan 1, 1986
65.632
-0.752
-1.13%
jan 1, 1987
59.757
-5.875
-8.95%
jan 1, 1988
64.436
+4.679
7.83%
jan 1, 1989
80.452
+16.016
24.86%
jan 1, 1990
90.895
+10.443
12.98%
jan 1, 1991
93.566
+2.671
2.94%
jan 1, 1992
79.633
-13.933
-14.89%
jan 1, 1993
70.048
-9.585
-12.04%
jan 1, 1994
71.541
+1.493
2.13%
jan 1, 1995
77.467
+5.926
8.28%
jan 1, 1996
76.687
-0.78
-1.01%
jan 1, 1997
81.483
+4.796
6.25%
jan 1, 1998
75.771
-5.712
-7.01%
jan 1, 1999
74.482
-1.29
-1.7%
jan 1, 2000
77.851
+3.369
4.52%
jan 1, 2001
84.021
+6.17
7.92%
jan 1, 2002
85.718
+1.697
2.02%
jan 1, 2003
76.844
-8.873
-10.35%
jan 1, 2004
80.874
+4.03
5.24%
jan 1, 2005
78.423
-2.451
-3.03%
jan 1, 2006
76.761
-1.662
-2.12%
jan 1, 2007
80.523
+3.761
4.9%
jan 1, 2008
75.042
-5.481
-6.81%
jan 1, 2009
90.424
+15.382
20.5%
jan 1, 2010
72.09
-18.333
-20.28%
jan 1, 2011
84.375
+12.285
17.04%
jan 1, 2012
86.139
+1.764
2.09%
jan 1, 2013
87.442
+1.303
1.51%
jan 1, 2014
93.88
+6.439
7.36%
jan 1, 2015
103.443
+9.563
10.19%
jan 1, 2016
93.549
-9.895
-9.57%
Ranking of countries by current statistics by years


Comments: