29
/
en
AIzaSyAYiBZKx7MnpbEhh9jyipgxe19OcubqV5w
April 1, 2024
98114
Cabo Verde
CPV
true
2
1
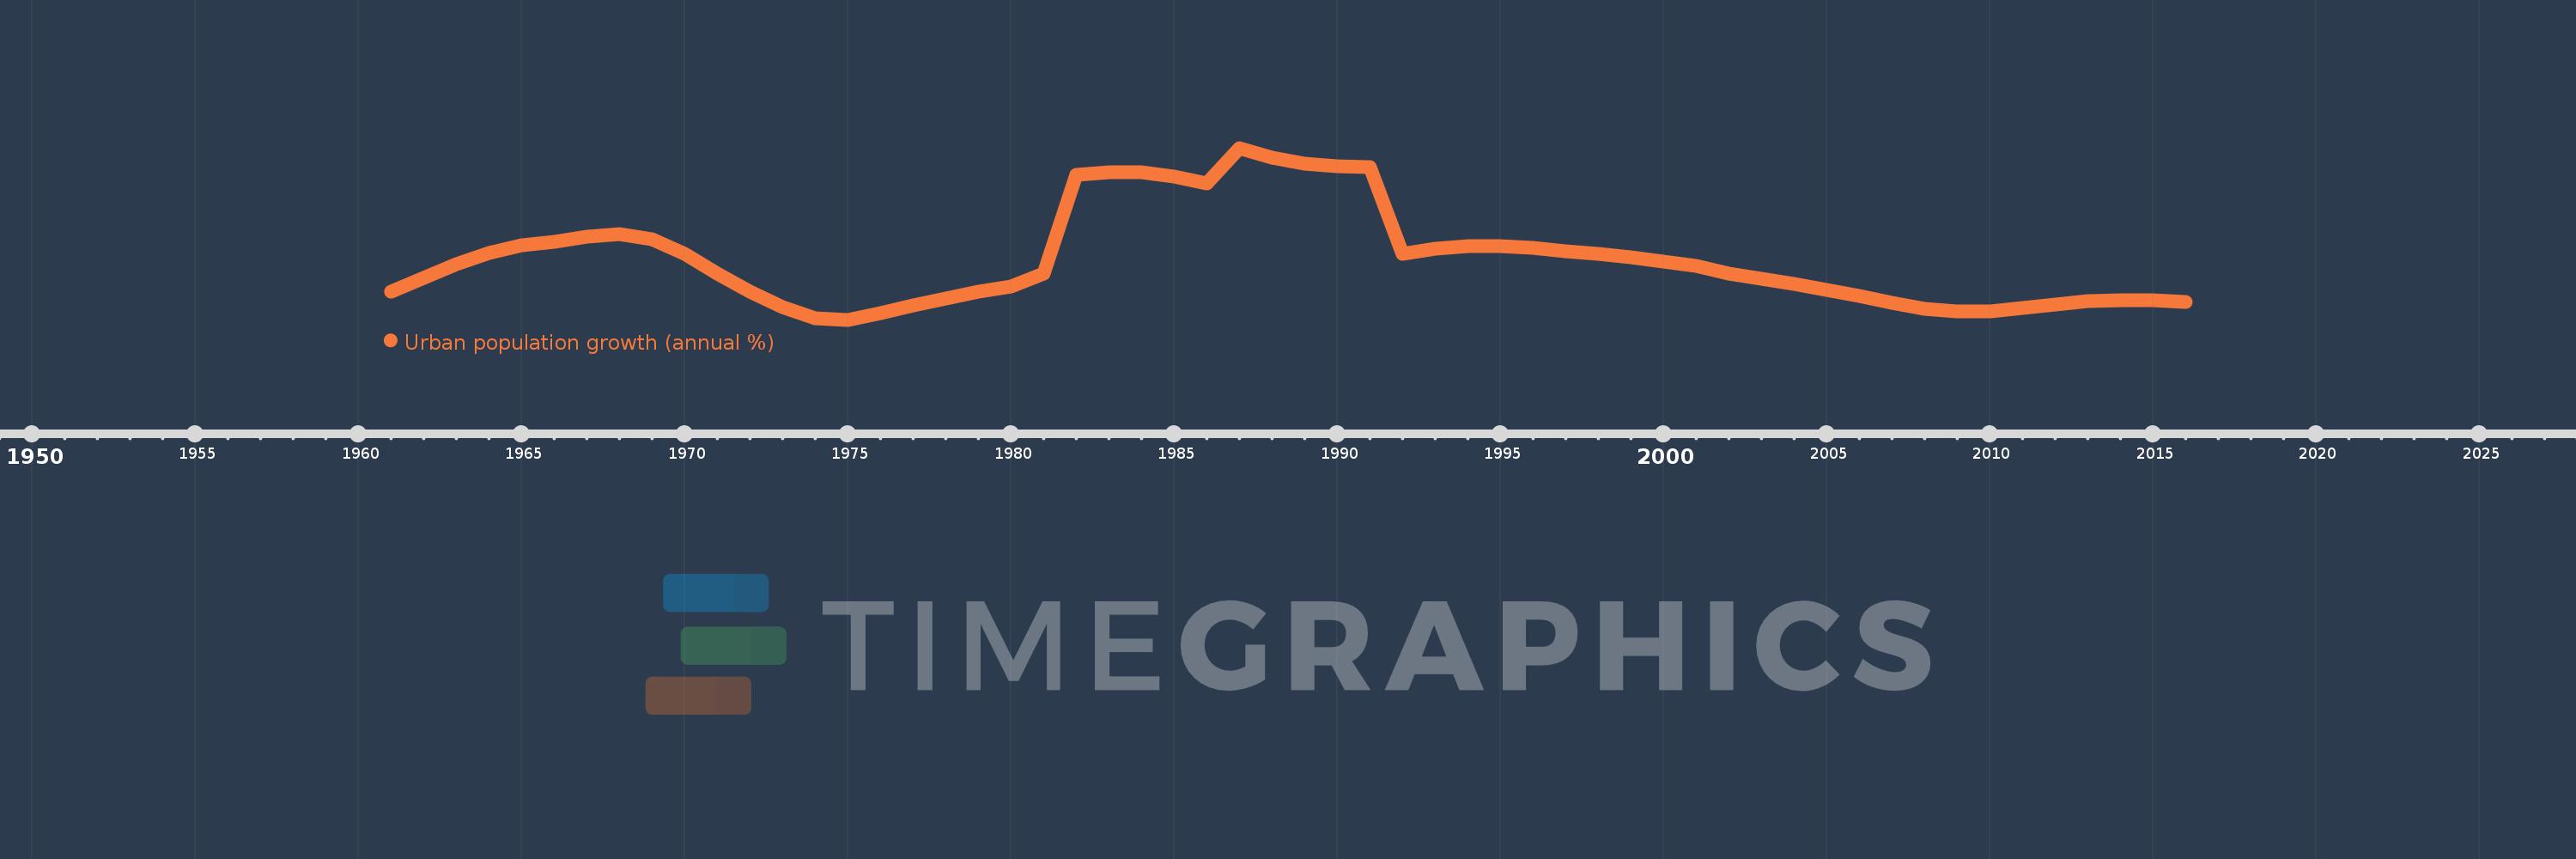
Urban population growth (annual %)
2016,2015,2014,2013,2012,2011,2010,2009,2008,2007,2006,2005,2004,2003,2002,2001,2000,1999,1998,1997,1996,1995,1994,1993,1992,1991,1990,1989,1988,1987,1986,1985,1984,1983,1982,1981,1980,1979,1978,1977,1976,1975,1974,1973,1972,1971,1970,1969,1968,1967,1966,1965,1964,1963,1962,1961
This statistics in other country:
AfghanistanAlbaniaAlgeriaAmerican SamoaAndorraAngolaAntigua and BarbudaArab WorldArgentinaArmeniaArubaAustraliaAustriaAzerbaijanBahamas, TheBahrainBangladeshBarbadosBelarusBelgiumBelizeBeninBermudaBhutanBoliviaBosnia and HerzegovinaBotswanaBrazilBritish Virgin IslandsBrunei DarussalamBulgariaBurkina FasoBurundiCabo VerdeCambodiaCameroonCanadaCaribbean small statesCayman IslandsCentral African RepublicCentral Europe and the BalticsChadChannel IslandsChileChinaColombiaComorosCongo, Dem. Rep.Congo, Rep.Costa RicaCote d'IvoireCroatiaCubaCuracaoCyprusCzech RepublicDenmarkDjiboutiDominicaDominican RepublicEarly-demographic dividendEast Asia & PacificEast Asia & Pacific (excluding high income)East Asia & Pacific (IDA & IBRD countries)EcuadorEgypt, Arab Rep.El SalvadorEquatorial GuineaEritreaEstoniaEthiopiaEuro areaEurope & Central AsiaEurope & Central Asia (excluding high income)Europe & Central Asia (IDA & IBRD countries)European UnionFaroe IslandsFijiFinlandFragile and conflict affected situationsFranceFrench PolynesiaGabonGambia, TheGeorgiaGermanyGhanaGibraltarGreeceGreenlandGrenadaGuamGuatemalaGuineaGuinea-BissauGuyanaHaitiHeavily indebted poor countries (HIPC)High incomeHondurasHong Kong SAR, ChinaHungaryIBRD onlyIcelandIDA & IBRD totalIDA blendIDA onlyIDA totalIndiaIndonesiaIran, Islamic Rep.IraqIrelandIsle of ManIsraelItalyJamaicaJapanJordanKazakhstanKenyaKiribatiKorea, Dem. People’s Rep.Korea, Rep.KuwaitKyrgyz RepublicLao PDRLate-demographic dividendLatin America & Caribbean Latin America & Caribbean (excluding high income)Latin America & the Caribbean (IDA & IBRD countries)LatviaLeast developed countries: UN classificationLebanonLesothoLiberiaLibyaLiechtensteinLithuaniaLow & middle incomeLow incomeLower middle incomeLuxembourgMacao SAR, ChinaMacedonia, FYRMadagascarMalawiMalaysiaMaldivesMaliMaltaMarshall IslandsMauritaniaMauritiusMexicoMicronesia, Fed. Sts.Middle East & North AfricaMiddle East & North Africa (excluding high income)Middle East & North Africa (IDA & IBRD countries)Middle incomeMoldovaMonacoMongoliaMontenegroMoroccoMozambiqueMyanmarNamibiaNauruNepalNetherlandsNew CaledoniaNew ZealandNicaraguaNigerNigeriaNorth AmericaNorthern Mariana IslandsNorwayOECD membersOmanOther small statesPacific island small statesPakistanPalauPanamaPapua New GuineaParaguayPeruPhilippinesPolandPortugalPost-demographic dividendPre-demographic dividendPuerto RicoQatarRomaniaRussian FederationRwandaSamoaSan MarinoSao Tome and PrincipeSaudi ArabiaSenegalSerbiaSeychellesSierra LeoneSingaporeSint Maarten (Dutch part)Slovak RepublicSloveniaSmall statesSolomon IslandsSomaliaSouth AfricaSouth AsiaSouth Asia (IDA & IBRD)South SudanSpainSri LankaSt. Kitts and NevisSt. LuciaSt. Vincent and the GrenadinesSub-Saharan Africa Sub-Saharan Africa (excluding high income)Sub-Saharan Africa (IDA & IBRD countries)SudanSurinameSwazilandSwedenSwitzerlandSyrian Arab RepublicTajikistanTanzaniaThailandTimor-LesteTogoTongaTrinidad and TobagoTunisiaTurkeyTurkmenistanTurks and Caicos IslandsTuvaluUgandaUkraineUnited Arab EmiratesUnited KingdomUnited StatesUpper middle incomeUruguayUzbekistanVanuatuVenezuela, RBVietnamVirgin Islands (U.S.)West Bank and GazaWorldYemen, Rep.ZambiaZimbabwe Timeline:
This timeline shows a graph from 1961 to 2016 of Cabo Verde. No data until 1960. Number of actual observations by date: 56.
Source name:
World Development Indicators
Source organization:
World Bank Staff estimates based on United Nations, World Urbanization Prospects.
Categories, topics:
Climate Change, Urban Development
Last updated:
apr 23, 2017
Indicators value changes by year
At the date of observation
Value
Absolute change
Change from previous value
jan 1, 1961
2.789
+2.789
0.0%
jan 1, 1962
3.386
+0.597
21.41%
jan 1, 1963
3.971
+0.585
17.29%
jan 1, 1964
4.432
+0.461
11.62%
jan 1, 1965
4.76
+0.328
7.4%
jan 1, 1966
4.922
+0.162
3.41%
jan 1, 1967
5.131
+0.208
4.23%
jan 1, 1968
5.26
+0.13
2.52%
jan 1, 1969
5.034
-0.226
-4.3%
jan 1, 1970
4.413
-0.621
-12.34%
jan 1, 1971
3.552
-0.862
-19.53%
jan 1, 1972
2.78
-0.771
-21.71%
jan 1, 1973
2.12
-0.661
-23.77%
jan 1, 1974
1.632
-0.488
-23.02%
jan 1, 1975
1.576
-0.056
-3.42%
jan 1, 1976
1.853
+0.277
17.61%
jan 1, 1977
2.202
+0.349
18.83%
jan 1, 1978
2.479
+0.277
12.56%
jan 1, 1979
2.765
+0.286
11.52%
jan 1, 1980
3.004
+0.239
8.66%
jan 1, 1981
3.566
+0.562
18.71%
jan 1, 1982
7.767
+4.201
117.81%
jan 1, 1983
7.903
+0.136
1.75%
jan 1, 1984
7.889
-0.014
-0.18%
jan 1, 1985
7.72
-0.169
-2.14%
jan 1, 1986
7.415
-0.306
-3.96%
jan 1, 1987
8.937
+1.522
20.53%
jan 1, 1988
8.532
-0.405
-4.54%
jan 1, 1989
8.27
-0.262
-3.07%
jan 1, 1990
8.166
-0.103
-1.25%
jan 1, 1991
8.12
-0.047
-0.57%
jan 1, 1992
4.41
-3.71
-45.69%
jan 1, 1993
4.627
+0.217
4.92%
jan 1, 1994
4.738
+0.112
2.42%
jan 1, 1995
4.735
-0.003
-0.07%
jan 1, 1996
4.641
-0.094
-1.98%
jan 1, 1997
4.526
-0.115
-2.48%
jan 1, 1998
4.405
-0.121
-2.68%
jan 1, 1999
4.26
-0.145
-3.3%
jan 1, 2000
4.075
-0.185
-4.34%
jan 1, 2001
3.866
-0.209
-5.13%
jan 1, 2002
3.535
-0.331
-8.55%
jan 1, 2003
3.344
-0.192
-5.42%
jan 1, 2004
3.117
-0.227
-6.78%
jan 1, 2005
2.859
-0.258
-8.27%
jan 1, 2006
2.583
-0.276
-9.66%
jan 1, 2007
2.294
-0.289
-11.18%
jan 1, 2008
2.043
-0.251
-10.96%
jan 1, 2009
1.918
-0.125
-6.12%
jan 1, 2010
1.943
+0.026
1.33%
jan 1, 2011
2.089
+0.145
7.49%
jan 1, 2012
2.241
+0.152
7.29%
jan 1, 2013
2.361
+0.12
5.35%
jan 1, 2014
2.425
+0.064
2.71%
jan 1, 2015
2.408
-0.017
-0.7%
jan 1, 2016
2.328
-0.08
-3.34%
Ranking of countries by current statistics by years


Comments: