29
/
en
AIzaSyAYiBZKx7MnpbEhh9jyipgxe19OcubqV5w
April 1, 2024
201134
Montenegro
MNE
true
2
1
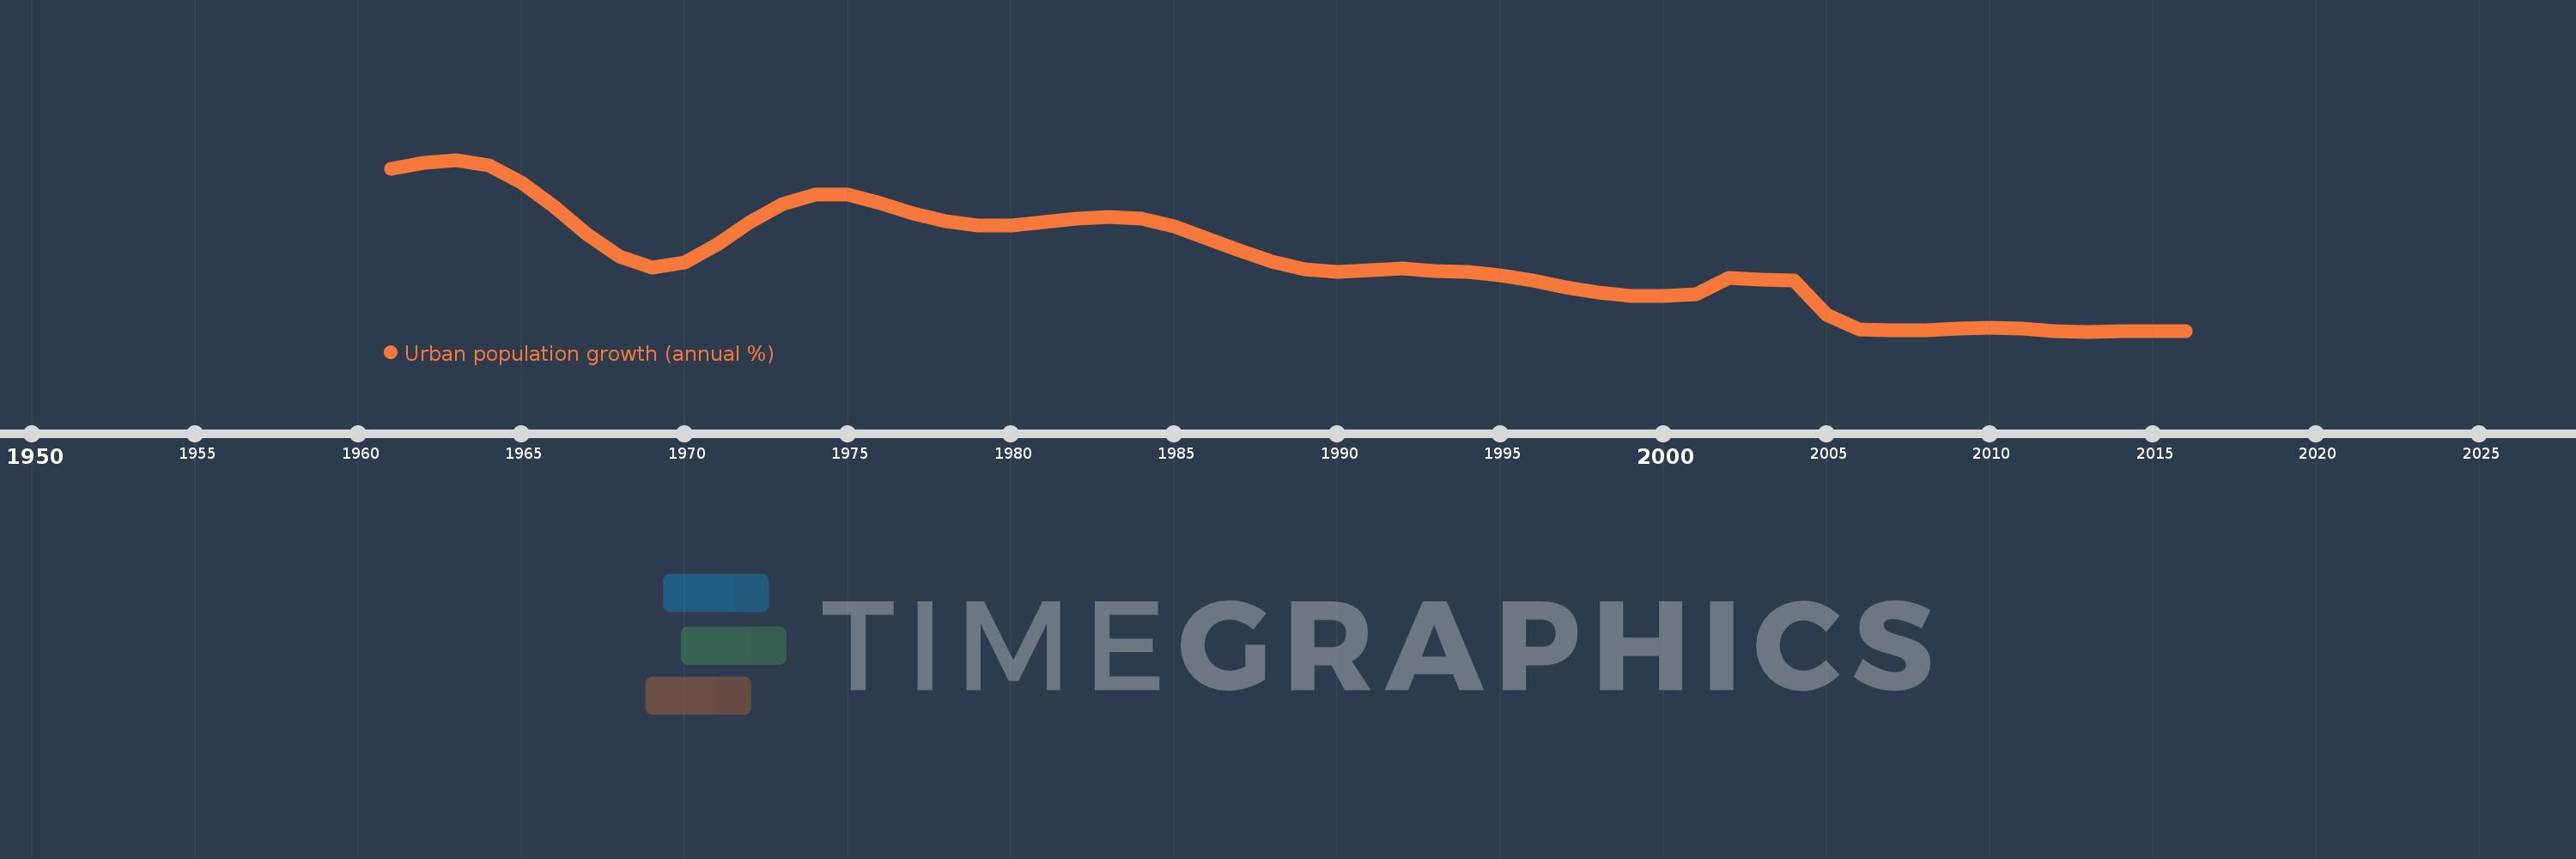
Urban population growth (annual %)
2016,2015,2014,2013,2012,2011,2010,2009,2008,2007,2006,2005,2004,2003,2002,2001,2000,1999,1998,1997,1996,1995,1994,1993,1992,1991,1990,1989,1988,1987,1986,1985,1984,1983,1982,1981,1980,1979,1978,1977,1976,1975,1974,1973,1972,1971,1970,1969,1968,1967,1966,1965,1964,1963,1962,1961
This statistics in other country:
AfghanistanAlbaniaAlgeriaAmerican SamoaAndorraAngolaAntigua and BarbudaArab WorldArgentinaArmeniaArubaAustraliaAustriaAzerbaijanBahamas, TheBahrainBangladeshBarbadosBelarusBelgiumBelizeBeninBermudaBhutanBoliviaBosnia and HerzegovinaBotswanaBrazilBritish Virgin IslandsBrunei DarussalamBulgariaBurkina FasoBurundiCabo VerdeCambodiaCameroonCanadaCaribbean small statesCayman IslandsCentral African RepublicCentral Europe and the BalticsChadChannel IslandsChileChinaColombiaComorosCongo, Dem. Rep.Congo, Rep.Costa RicaCote d'IvoireCroatiaCubaCuracaoCyprusCzech RepublicDenmarkDjiboutiDominicaDominican RepublicEarly-demographic dividendEast Asia & PacificEast Asia & Pacific (excluding high income)East Asia & Pacific (IDA & IBRD countries)EcuadorEgypt, Arab Rep.El SalvadorEquatorial GuineaEritreaEstoniaEthiopiaEuro areaEurope & Central AsiaEurope & Central Asia (excluding high income)Europe & Central Asia (IDA & IBRD countries)European UnionFaroe IslandsFijiFinlandFragile and conflict affected situationsFranceFrench PolynesiaGabonGambia, TheGeorgiaGermanyGhanaGibraltarGreeceGreenlandGrenadaGuamGuatemalaGuineaGuinea-BissauGuyanaHaitiHeavily indebted poor countries (HIPC)High incomeHondurasHong Kong SAR, ChinaHungaryIBRD onlyIcelandIDA & IBRD totalIDA blendIDA onlyIDA totalIndiaIndonesiaIran, Islamic Rep.IraqIrelandIsle of ManIsraelItalyJamaicaJapanJordanKazakhstanKenyaKiribatiKorea, Dem. People’s Rep.Korea, Rep.KuwaitKyrgyz RepublicLao PDRLate-demographic dividendLatin America & Caribbean Latin America & Caribbean (excluding high income)Latin America & the Caribbean (IDA & IBRD countries)LatviaLeast developed countries: UN classificationLebanonLesothoLiberiaLibyaLiechtensteinLithuaniaLow & middle incomeLow incomeLower middle incomeLuxembourgMacao SAR, ChinaMacedonia, FYRMadagascarMalawiMalaysiaMaldivesMaliMaltaMarshall IslandsMauritaniaMauritiusMexicoMicronesia, Fed. Sts.Middle East & North AfricaMiddle East & North Africa (excluding high income)Middle East & North Africa (IDA & IBRD countries)Middle incomeMoldovaMonacoMongoliaMontenegroMoroccoMozambiqueMyanmarNamibiaNauruNepalNetherlandsNew CaledoniaNew ZealandNicaraguaNigerNigeriaNorth AmericaNorthern Mariana IslandsNorwayOECD membersOmanOther small statesPacific island small statesPakistanPalauPanamaPapua New GuineaParaguayPeruPhilippinesPolandPortugalPost-demographic dividendPre-demographic dividendPuerto RicoQatarRomaniaRussian FederationRwandaSamoaSan MarinoSao Tome and PrincipeSaudi ArabiaSenegalSerbiaSeychellesSierra LeoneSingaporeSint Maarten (Dutch part)Slovak RepublicSloveniaSmall statesSolomon IslandsSomaliaSouth AfricaSouth AsiaSouth Asia (IDA & IBRD)South SudanSpainSri LankaSt. Kitts and NevisSt. LuciaSt. Vincent and the GrenadinesSub-Saharan Africa Sub-Saharan Africa (excluding high income)Sub-Saharan Africa (IDA & IBRD countries)SudanSurinameSwazilandSwedenSwitzerlandSyrian Arab RepublicTajikistanTanzaniaThailandTimor-LesteTogoTongaTrinidad and TobagoTunisiaTurkeyTurkmenistanTurks and Caicos IslandsTuvaluUgandaUkraineUnited Arab EmiratesUnited KingdomUnited StatesUpper middle incomeUruguayUzbekistanVanuatuVenezuela, RBVietnamVirgin Islands (U.S.)West Bank and GazaWorldYemen, Rep.ZambiaZimbabwe Timeline:
This timeline shows a graph from 1961 to 2016 of Montenegro. No data until 1960. Number of actual observations by date: 56.
Source name:
World Development Indicators
Source organization:
World Bank Staff estimates based on United Nations, World Urbanization Prospects.
Categories, topics:
Climate Change, Urban Development
Last updated:
apr 23, 2017
Indicators value changes by year
At the date of observation
Value
Absolute change
Change from previous value
jan 1, 1961
5.705
+5.705
0.0%
jan 1, 1962
5.904
+0.199
3.48%
jan 1, 1963
5.998
+0.095
1.6%
jan 1, 1964
5.804
-0.195
-3.25%
jan 1, 1965
5.247
-0.557
-9.59%
jan 1, 1966
4.464
-0.783
-14.93%
jan 1, 1967
3.574
-0.889
-19.93%
jan 1, 1968
2.826
-0.748
-20.94%
jan 1, 1969
2.463
-0.362
-12.82%
jan 1, 1970
2.63
+0.166
6.75%
jan 1, 1971
3.22
+0.59
22.45%
jan 1, 1972
3.946
+0.726
22.55%
jan 1, 1973
4.541
+0.595
15.07%
jan 1, 1974
4.869
+0.329
7.24%
jan 1, 1975
4.852
-0.018
-0.36%
jan 1, 1976
4.579
-0.273
-5.63%
jan 1, 1977
4.243
-0.335
-7.32%
jan 1, 1978
3.987
-0.256
-6.04%
jan 1, 1979
3.84
-0.147
-3.69%
jan 1, 1980
3.847
+0.008
0.2%
jan 1, 1981
3.951
+0.103
2.69%
jan 1, 1982
4.076
+0.125
3.16%
jan 1, 1983
4.137
+0.061
1.49%
jan 1, 1984
4.063
-0.073
-1.77%
jan 1, 1985
3.813
-0.251
-6.17%
jan 1, 1986
3.433
-0.38
-9.96%
jan 1, 1987
3.018
-0.415
-12.08%
jan 1, 1988
2.656
-0.362
-11.99%
jan 1, 1989
2.415
-0.241
-9.09%
jan 1, 1990
2.338
-0.077
-3.19%
jan 1, 1991
2.392
+0.054
2.33%
jan 1, 1992
2.442
+0.049
2.06%
jan 1, 1993
2.351
-0.09
-3.7%
jan 1, 1994
2.339
-0.013
-0.54%
jan 1, 1995
2.227
-0.112
-4.78%
jan 1, 1996
2.036
-0.191
-8.56%
jan 1, 1997
1.827
-0.209
-10.28%
jan 1, 1998
1.648
-0.179
-9.77%
jan 1, 1999
1.548
-0.101
-6.13%
jan 1, 2000
1.533
-0.014
-0.91%
jan 1, 2001
1.594
+0.061
3.98%
jan 1, 2002
2.121
+0.527
33.04%
jan 1, 2003
2.081
-0.041
-1.91%
jan 1, 2004
2.037
-0.044
-2.11%
jan 1, 2005
0.909
-1.128
-55.38%
jan 1, 2006
0.438
-0.471
-51.85%
jan 1, 2007
0.413
-0.024
-5.5%
jan 1, 2008
0.426
+0.013
3.04%
jan 1, 2009
0.463
+0.037
8.73%
jan 1, 2010
0.499
+0.036
7.81%
jan 1, 2011
0.466
-0.034
-6.75%
jan 1, 2012
0.387
-0.079
-16.93%
jan 1, 2013
0.373
-0.014
-3.6%
jan 1, 2014
0.39
+0.017
4.65%
jan 1, 2015
0.394
+0.003
0.84%
jan 1, 2016
0.396
+0.003
0.69%
Ranking of countries by current statistics by years


Comments: