29
/
en
AIzaSyAYiBZKx7MnpbEhh9jyipgxe19OcubqV5w
April 1, 2024
113140
Costa Rica
CRI
true
2
1
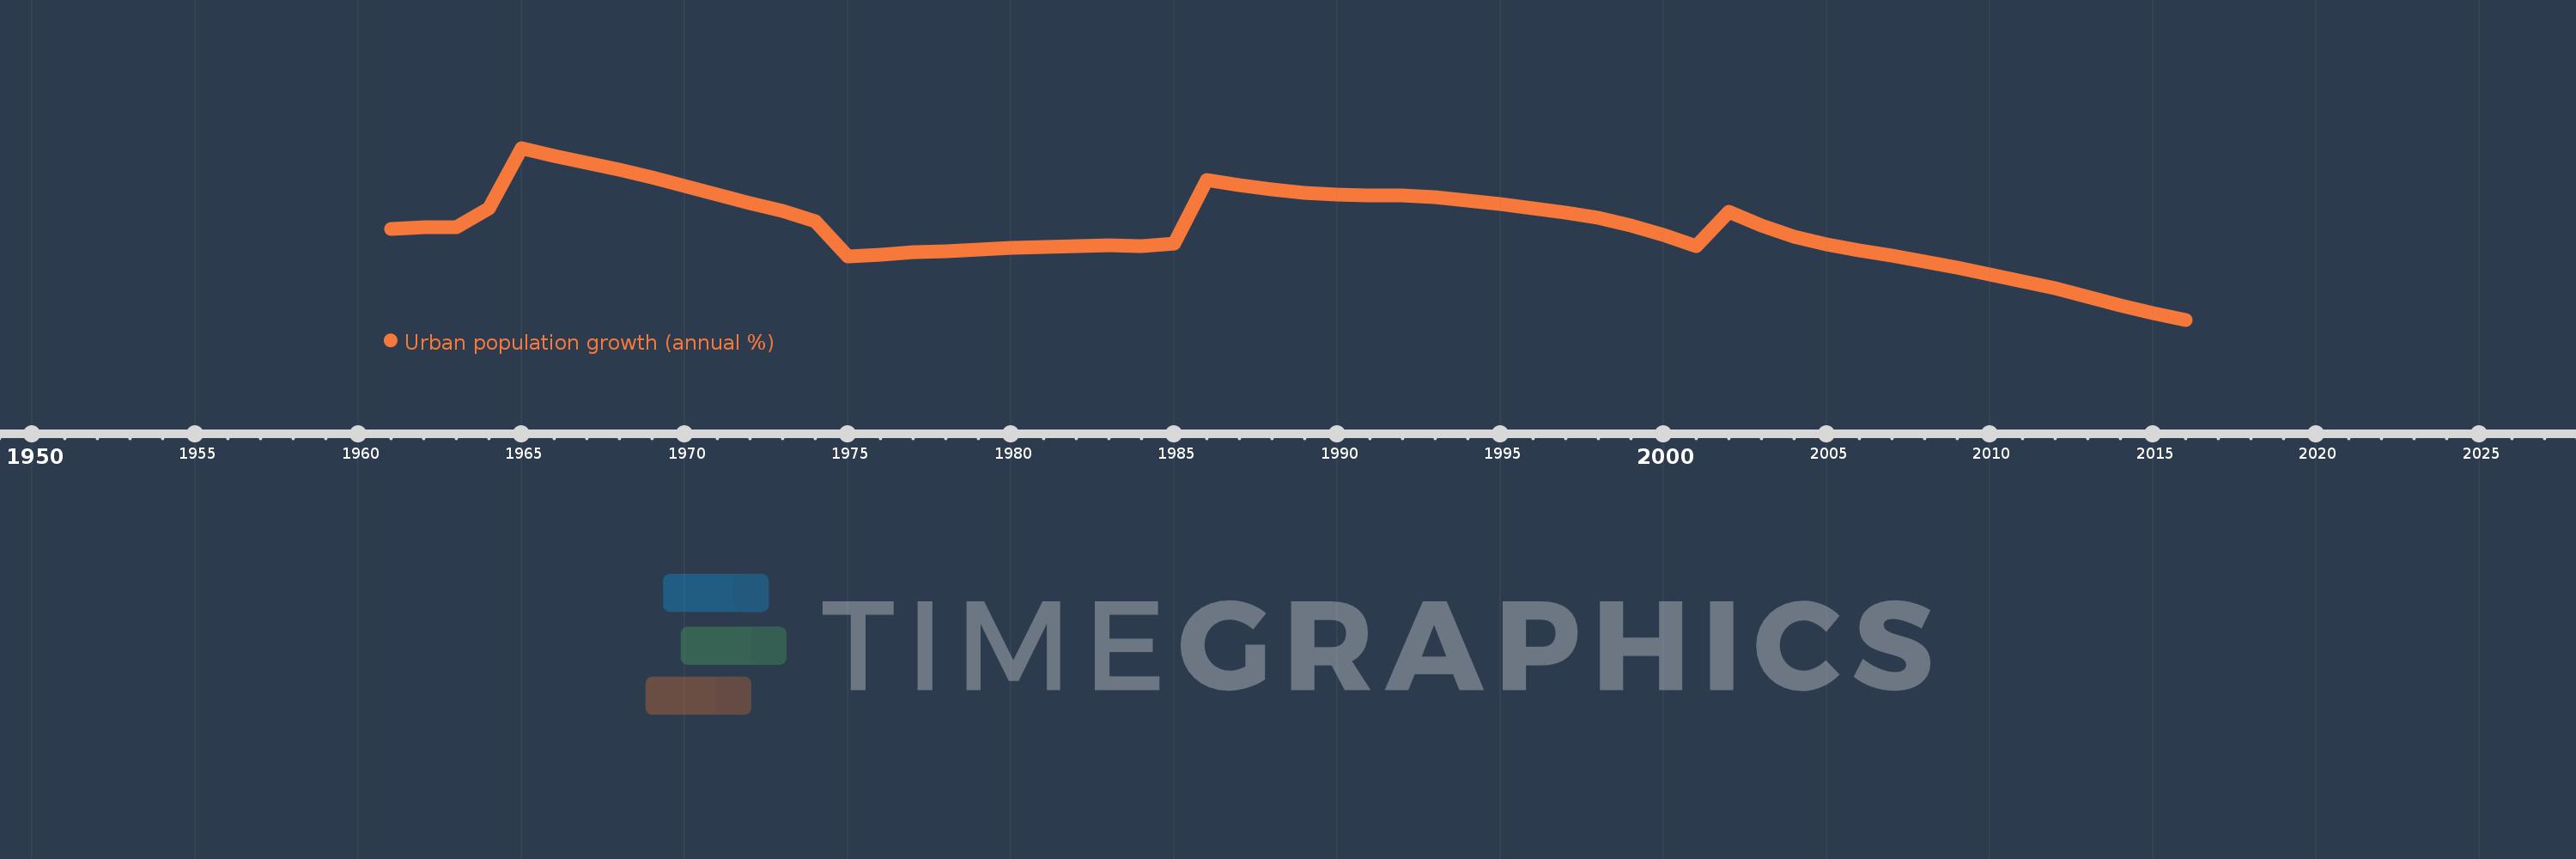
Urban population growth (annual %)
2016,2015,2014,2013,2012,2011,2010,2009,2008,2007,2006,2005,2004,2003,2002,2001,2000,1999,1998,1997,1996,1995,1994,1993,1992,1991,1990,1989,1988,1987,1986,1985,1984,1983,1982,1981,1980,1979,1978,1977,1976,1975,1974,1973,1972,1971,1970,1969,1968,1967,1966,1965,1964,1963,1962,1961
This statistics in other country:
AfghanistanAlbaniaAlgeriaAmerican SamoaAndorraAngolaAntigua and BarbudaArab WorldArgentinaArmeniaArubaAustraliaAustriaAzerbaijanBahamas, TheBahrainBangladeshBarbadosBelarusBelgiumBelizeBeninBermudaBhutanBoliviaBosnia and HerzegovinaBotswanaBrazilBritish Virgin IslandsBrunei DarussalamBulgariaBurkina FasoBurundiCabo VerdeCambodiaCameroonCanadaCaribbean small statesCayman IslandsCentral African RepublicCentral Europe and the BalticsChadChannel IslandsChileChinaColombiaComorosCongo, Dem. Rep.Congo, Rep.Costa RicaCote d'IvoireCroatiaCubaCuracaoCyprusCzech RepublicDenmarkDjiboutiDominicaDominican RepublicEarly-demographic dividendEast Asia & PacificEast Asia & Pacific (excluding high income)East Asia & Pacific (IDA & IBRD countries)EcuadorEgypt, Arab Rep.El SalvadorEquatorial GuineaEritreaEstoniaEthiopiaEuro areaEurope & Central AsiaEurope & Central Asia (excluding high income)Europe & Central Asia (IDA & IBRD countries)European UnionFaroe IslandsFijiFinlandFragile and conflict affected situationsFranceFrench PolynesiaGabonGambia, TheGeorgiaGermanyGhanaGibraltarGreeceGreenlandGrenadaGuamGuatemalaGuineaGuinea-BissauGuyanaHaitiHeavily indebted poor countries (HIPC)High incomeHondurasHong Kong SAR, ChinaHungaryIBRD onlyIcelandIDA & IBRD totalIDA blendIDA onlyIDA totalIndiaIndonesiaIran, Islamic Rep.IraqIrelandIsle of ManIsraelItalyJamaicaJapanJordanKazakhstanKenyaKiribatiKorea, Dem. People’s Rep.Korea, Rep.KuwaitKyrgyz RepublicLao PDRLate-demographic dividendLatin America & Caribbean Latin America & Caribbean (excluding high income)Latin America & the Caribbean (IDA & IBRD countries)LatviaLeast developed countries: UN classificationLebanonLesothoLiberiaLibyaLiechtensteinLithuaniaLow & middle incomeLow incomeLower middle incomeLuxembourgMacao SAR, ChinaMacedonia, FYRMadagascarMalawiMalaysiaMaldivesMaliMaltaMarshall IslandsMauritaniaMauritiusMexicoMicronesia, Fed. Sts.Middle East & North AfricaMiddle East & North Africa (excluding high income)Middle East & North Africa (IDA & IBRD countries)Middle incomeMoldovaMonacoMongoliaMontenegroMoroccoMozambiqueMyanmarNamibiaNauruNepalNetherlandsNew CaledoniaNew ZealandNicaraguaNigerNigeriaNorth AmericaNorthern Mariana IslandsNorwayOECD membersOmanOther small statesPacific island small statesPakistanPalauPanamaPapua New GuineaParaguayPeruPhilippinesPolandPortugalPost-demographic dividendPre-demographic dividendPuerto RicoQatarRomaniaRussian FederationRwandaSamoaSan MarinoSao Tome and PrincipeSaudi ArabiaSenegalSerbiaSeychellesSierra LeoneSingaporeSint Maarten (Dutch part)Slovak RepublicSloveniaSmall statesSolomon IslandsSomaliaSouth AfricaSouth AsiaSouth Asia (IDA & IBRD)South SudanSpainSri LankaSt. Kitts and NevisSt. LuciaSt. Vincent and the GrenadinesSub-Saharan Africa Sub-Saharan Africa (excluding high income)Sub-Saharan Africa (IDA & IBRD countries)SudanSurinameSwazilandSwedenSwitzerlandSyrian Arab RepublicTajikistanTanzaniaThailandTimor-LesteTogoTongaTrinidad and TobagoTunisiaTurkeyTurkmenistanTurks and Caicos IslandsTuvaluUgandaUkraineUnited Arab EmiratesUnited KingdomUnited StatesUpper middle incomeUruguayUzbekistanVanuatuVenezuela, RBVietnamVirgin Islands (U.S.)West Bank and GazaWorldYemen, Rep.ZambiaZimbabwe Timeline:
This timeline shows a graph from 1961 to 2016 of Costa Rica. No data until 1960. Number of actual observations by date: 56.
Source name:
World Development Indicators
Source organization:
World Bank Staff estimates based on United Nations, World Urbanization Prospects.
Categories, topics:
Climate Change, Urban Development
Last updated:
apr 23, 2017
Indicators value changes by year
At the date of observation
Value
Absolute change
Change from previous value
jan 1, 1961
3.794
+3.794
0.0%
jan 1, 1962
3.82
+0.026
0.68%
jan 1, 1963
3.819
-0.001
-0.02%
jan 1, 1964
4.146
+0.327
8.57%
jan 1, 1965
5.17
+1.024
24.7%
jan 1, 1966
5.038
-0.132
-2.56%
jan 1, 1967
4.913
-0.125
-2.48%
jan 1, 1968
4.792
-0.121
-2.47%
jan 1, 1969
4.662
-0.13
-2.71%
jan 1, 1970
4.514
-0.147
-3.16%
jan 1, 1971
4.369
-0.145
-3.21%
jan 1, 1972
4.221
-0.148
-3.4%
jan 1, 1973
4.099
-0.122
-2.88%
jan 1, 1974
3.925
-0.175
-4.26%
jan 1, 1975
3.316
-0.608
-15.5%
jan 1, 1976
3.345
+0.029
0.86%
jan 1, 1977
3.386
+0.041
1.24%
jan 1, 1978
3.411
+0.025
0.74%
jan 1, 1979
3.441
+0.03
0.87%
jan 1, 1980
3.462
+0.021
0.6%
jan 1, 1981
3.475
+0.013
0.39%
jan 1, 1982
3.488
+0.013
0.37%
jan 1, 1983
3.504
+0.016
0.47%
jan 1, 1984
3.494
-0.01
-0.29%
jan 1, 1985
3.531
+0.038
1.08%
jan 1, 1986
4.622
+1.09
30.87%
jan 1, 1987
4.537
-0.085
-1.83%
jan 1, 1988
4.455
-0.082
-1.8%
jan 1, 1989
4.401
-0.054
-1.22%
jan 1, 1990
4.37
-0.03
-0.69%
jan 1, 1991
4.365
-0.006
-0.13%
jan 1, 1992
4.352
-0.013
-0.29%
jan 1, 1993
4.323
-0.029
-0.67%
jan 1, 1994
4.275
-0.048
-1.11%
jan 1, 1995
4.214
-0.061
-1.42%
jan 1, 1996
4.136
-0.078
-1.85%
jan 1, 1997
4.062
-0.074
-1.8%
jan 1, 1998
3.972
-0.089
-2.2%
jan 1, 1999
3.851
-0.121
-3.05%
jan 1, 2000
3.682
-0.169
-4.39%
jan 1, 2001
3.501
-0.181
-4.92%
jan 1, 2002
4.075
+0.574
16.39%
jan 1, 2003
3.848
-0.227
-5.56%
jan 1, 2004
3.657
-0.191
-4.96%
jan 1, 2005
3.522
-0.136
-3.71%
jan 1, 2006
3.416
-0.105
-2.99%
jan 1, 2007
3.33
-0.087
-2.54%
jan 1, 2008
3.234
-0.096
-2.87%
jan 1, 2009
3.131
-0.103
-3.18%
jan 1, 2010
3.013
-0.119
-3.79%
jan 1, 2011
2.894
-0.119
-3.94%
jan 1, 2012
2.773
-0.121
-4.17%
jan 1, 2013
2.623
-0.15
-5.42%
jan 1, 2014
2.482
-0.141
-5.37%
jan 1, 2015
2.353
-0.129
-5.2%
jan 1, 2016
2.237
-0.116
-4.92%
Ranking of countries by current statistics by years


Comments: