29
/
en
AIzaSyAYiBZKx7MnpbEhh9jyipgxe19OcubqV5w
April 1, 2024
274448
Ukraine
UKR
true
2
1
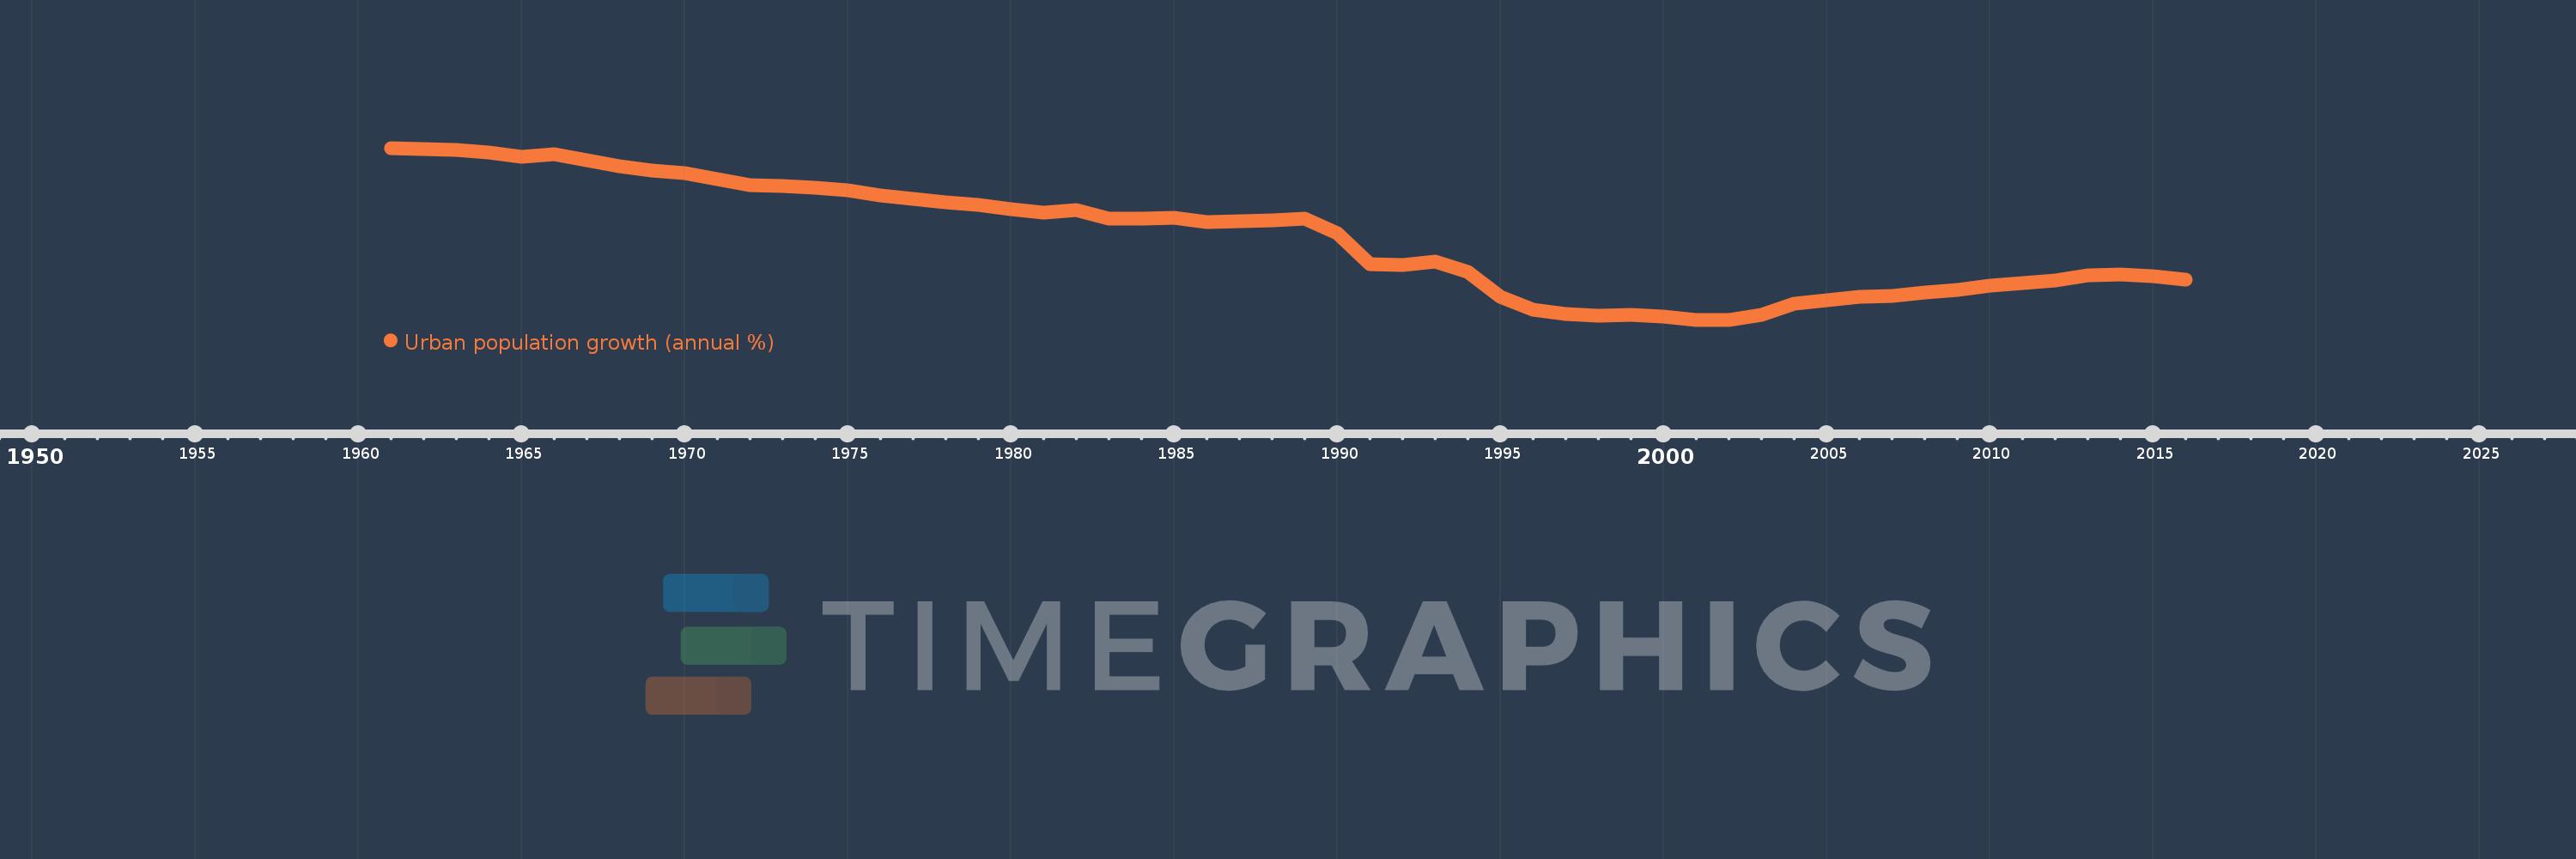
Urban population growth (annual %)
2016,2015,2014,2013,2012,2011,2010,2009,2008,2007,2006,2005,2004,2003,2002,2001,2000,1999,1998,1997,1996,1995,1994,1993,1992,1991,1990,1989,1988,1987,1986,1985,1984,1983,1982,1981,1980,1979,1978,1977,1976,1975,1974,1973,1972,1971,1970,1969,1968,1967,1966,1965,1964,1963,1962,1961
This statistics in other country:
AfghanistanAlbaniaAlgeriaAmerican SamoaAndorraAngolaAntigua and BarbudaArab WorldArgentinaArmeniaArubaAustraliaAustriaAzerbaijanBahamas, TheBahrainBangladeshBarbadosBelarusBelgiumBelizeBeninBermudaBhutanBoliviaBosnia and HerzegovinaBotswanaBrazilBritish Virgin IslandsBrunei DarussalamBulgariaBurkina FasoBurundiCabo VerdeCambodiaCameroonCanadaCaribbean small statesCayman IslandsCentral African RepublicCentral Europe and the BalticsChadChannel IslandsChileChinaColombiaComorosCongo, Dem. Rep.Congo, Rep.Costa RicaCote d'IvoireCroatiaCubaCuracaoCyprusCzech RepublicDenmarkDjiboutiDominicaDominican RepublicEarly-demographic dividendEast Asia & PacificEast Asia & Pacific (excluding high income)East Asia & Pacific (IDA & IBRD countries)EcuadorEgypt, Arab Rep.El SalvadorEquatorial GuineaEritreaEstoniaEthiopiaEuro areaEurope & Central AsiaEurope & Central Asia (excluding high income)Europe & Central Asia (IDA & IBRD countries)European UnionFaroe IslandsFijiFinlandFragile and conflict affected situationsFranceFrench PolynesiaGabonGambia, TheGeorgiaGermanyGhanaGibraltarGreeceGreenlandGrenadaGuamGuatemalaGuineaGuinea-BissauGuyanaHaitiHeavily indebted poor countries (HIPC)High incomeHondurasHong Kong SAR, ChinaHungaryIBRD onlyIcelandIDA & IBRD totalIDA blendIDA onlyIDA totalIndiaIndonesiaIran, Islamic Rep.IraqIrelandIsle of ManIsraelItalyJamaicaJapanJordanKazakhstanKenyaKiribatiKorea, Dem. People’s Rep.Korea, Rep.KuwaitKyrgyz RepublicLao PDRLate-demographic dividendLatin America & Caribbean Latin America & Caribbean (excluding high income)Latin America & the Caribbean (IDA & IBRD countries)LatviaLeast developed countries: UN classificationLebanonLesothoLiberiaLibyaLiechtensteinLithuaniaLow & middle incomeLow incomeLower middle incomeLuxembourgMacao SAR, ChinaMacedonia, FYRMadagascarMalawiMalaysiaMaldivesMaliMaltaMarshall IslandsMauritaniaMauritiusMexicoMicronesia, Fed. Sts.Middle East & North AfricaMiddle East & North Africa (excluding high income)Middle East & North Africa (IDA & IBRD countries)Middle incomeMoldovaMonacoMongoliaMontenegroMoroccoMozambiqueMyanmarNamibiaNauruNepalNetherlandsNew CaledoniaNew ZealandNicaraguaNigerNigeriaNorth AmericaNorthern Mariana IslandsNorwayOECD membersOmanOther small statesPacific island small statesPakistanPalauPanamaPapua New GuineaParaguayPeruPhilippinesPolandPortugalPost-demographic dividendPre-demographic dividendPuerto RicoQatarRomaniaRussian FederationRwandaSamoaSan MarinoSao Tome and PrincipeSaudi ArabiaSenegalSerbiaSeychellesSierra LeoneSingaporeSint Maarten (Dutch part)Slovak RepublicSloveniaSmall statesSolomon IslandsSomaliaSouth AfricaSouth AsiaSouth Asia (IDA & IBRD)South SudanSpainSri LankaSt. Kitts and NevisSt. LuciaSt. Vincent and the GrenadinesSub-Saharan Africa Sub-Saharan Africa (excluding high income)Sub-Saharan Africa (IDA & IBRD countries)SudanSurinameSwazilandSwedenSwitzerlandSyrian Arab RepublicTajikistanTanzaniaThailandTimor-LesteTogoTongaTrinidad and TobagoTunisiaTurkeyTurkmenistanTurks and Caicos IslandsTuvaluUgandaUkraineUnited Arab EmiratesUnited KingdomUnited StatesUpper middle incomeUruguayUzbekistanVanuatuVenezuela, RBVietnamVirgin Islands (U.S.)West Bank and GazaWorldYemen, Rep.ZambiaZimbabwe Timeline:
This timeline shows a graph from 1961 to 2016 of Ukraine. No data until 1960. Number of actual observations by date: 56.
Source name:
World Development Indicators
Source organization:
World Bank Staff estimates based on United Nations, World Urbanization Prospects.
Categories, topics:
Climate Change, Urban Development
Last updated:
apr 23, 2017
Indicators value changes by year
Minimum:
-0.949
jan 1, 2002
At the date of observation
Value
Absolute change
Change from previous value
jan 1, 1961
2.87
+2.87
0.0%
jan 1, 1962
2.851
-0.019
-0.66%
jan 1, 1963
2.825
-0.027
-0.93%
jan 1, 1964
2.764
-0.061
-2.16%
jan 1, 1965
2.667
-0.097
-3.5%
jan 1, 1966
2.729
+0.062
2.32%
jan 1, 1967
2.589
-0.14
-5.14%
jan 1, 1968
2.459
-0.129
-4.99%
jan 1, 1969
2.363
-0.097
-3.94%
jan 1, 1970
2.301
-0.062
-2.62%
jan 1, 1971
2.174
-0.127
-5.5%
jan 1, 1972
2.041
-0.134
-6.14%
jan 1, 1973
2.021
-0.019
-0.95%
jan 1, 1974
1.98
-0.041
-2.03%
jan 1, 1975
1.923
-0.058
-2.92%
jan 1, 1976
1.812
-0.11
-5.74%
jan 1, 1977
1.735
-0.077
-4.26%
jan 1, 1978
1.663
-0.072
-4.17%
jan 1, 1979
1.605
-0.058
-3.47%
jan 1, 1980
1.517
-0.088
-5.46%
jan 1, 1981
1.436
-0.082
-5.39%
jan 1, 1982
1.483
+0.047
3.27%
jan 1, 1983
1.289
-0.194
-13.06%
jan 1, 1984
1.306
+0.017
1.32%
jan 1, 1985
1.309
+0.003
0.25%
jan 1, 1986
1.223
-0.086
-6.59%
jan 1, 1987
1.241
+0.018
1.48%
jan 1, 1988
1.256
+0.015
1.17%
jan 1, 1989
1.304
+0.049
3.87%
jan 1, 1990
0.967
-0.337
-25.84%
jan 1, 1991
0.288
-0.679
-70.22%
jan 1, 1992
0.267
-0.021
-7.22%
jan 1, 1993
0.346
+0.079
29.49%
jan 1, 1994
0.114
-0.232
-67.11%
jan 1, 1995
-0.439
-0.553
-485.86%
jan 1, 1996
-0.732
-0.293
66.69%
jan 1, 1997
-0.829
-0.097
13.26%
jan 1, 1998
-0.853
-0.024
2.86%
jan 1, 1999
-0.837
+0.016
-1.86%
jan 1, 2000
-0.885
-0.048
5.7%
jan 1, 2001
-0.948
-0.064
7.2%
jan 1, 2002
-0.949
0.0
0.04%
jan 1, 2003
-0.845
+0.104
-10.96%
jan 1, 2004
-0.598
+0.247
-29.27%
jan 1, 2005
-0.507
+0.091
-15.2%
jan 1, 2006
-0.448
+0.059
-11.67%
jan 1, 2007
-0.412
+0.035
-7.88%
jan 1, 2008
-0.335
+0.077
-18.7%
jan 1, 2009
-0.281
+0.055
-16.3%
jan 1, 2010
-0.185
+0.095
-34.0%
jan 1, 2011
-0.129
+0.056
-30.33%
jan 1, 2012
-0.083
+0.046
-35.49%
jan 1, 2013
0.037
+0.12
-144.53%
jan 1, 2014
0.064
+0.027
73.52%
jan 1, 2015
0.021
-0.043
-67.52%
jan 1, 2016
-0.058
-0.079
-375.95%
Ranking of countries by current statistics by years


Comments: