29
/
en
AIzaSyAYiBZKx7MnpbEhh9jyipgxe19OcubqV5w
April 1, 2024
68530
Angola
AGO
true
2
1
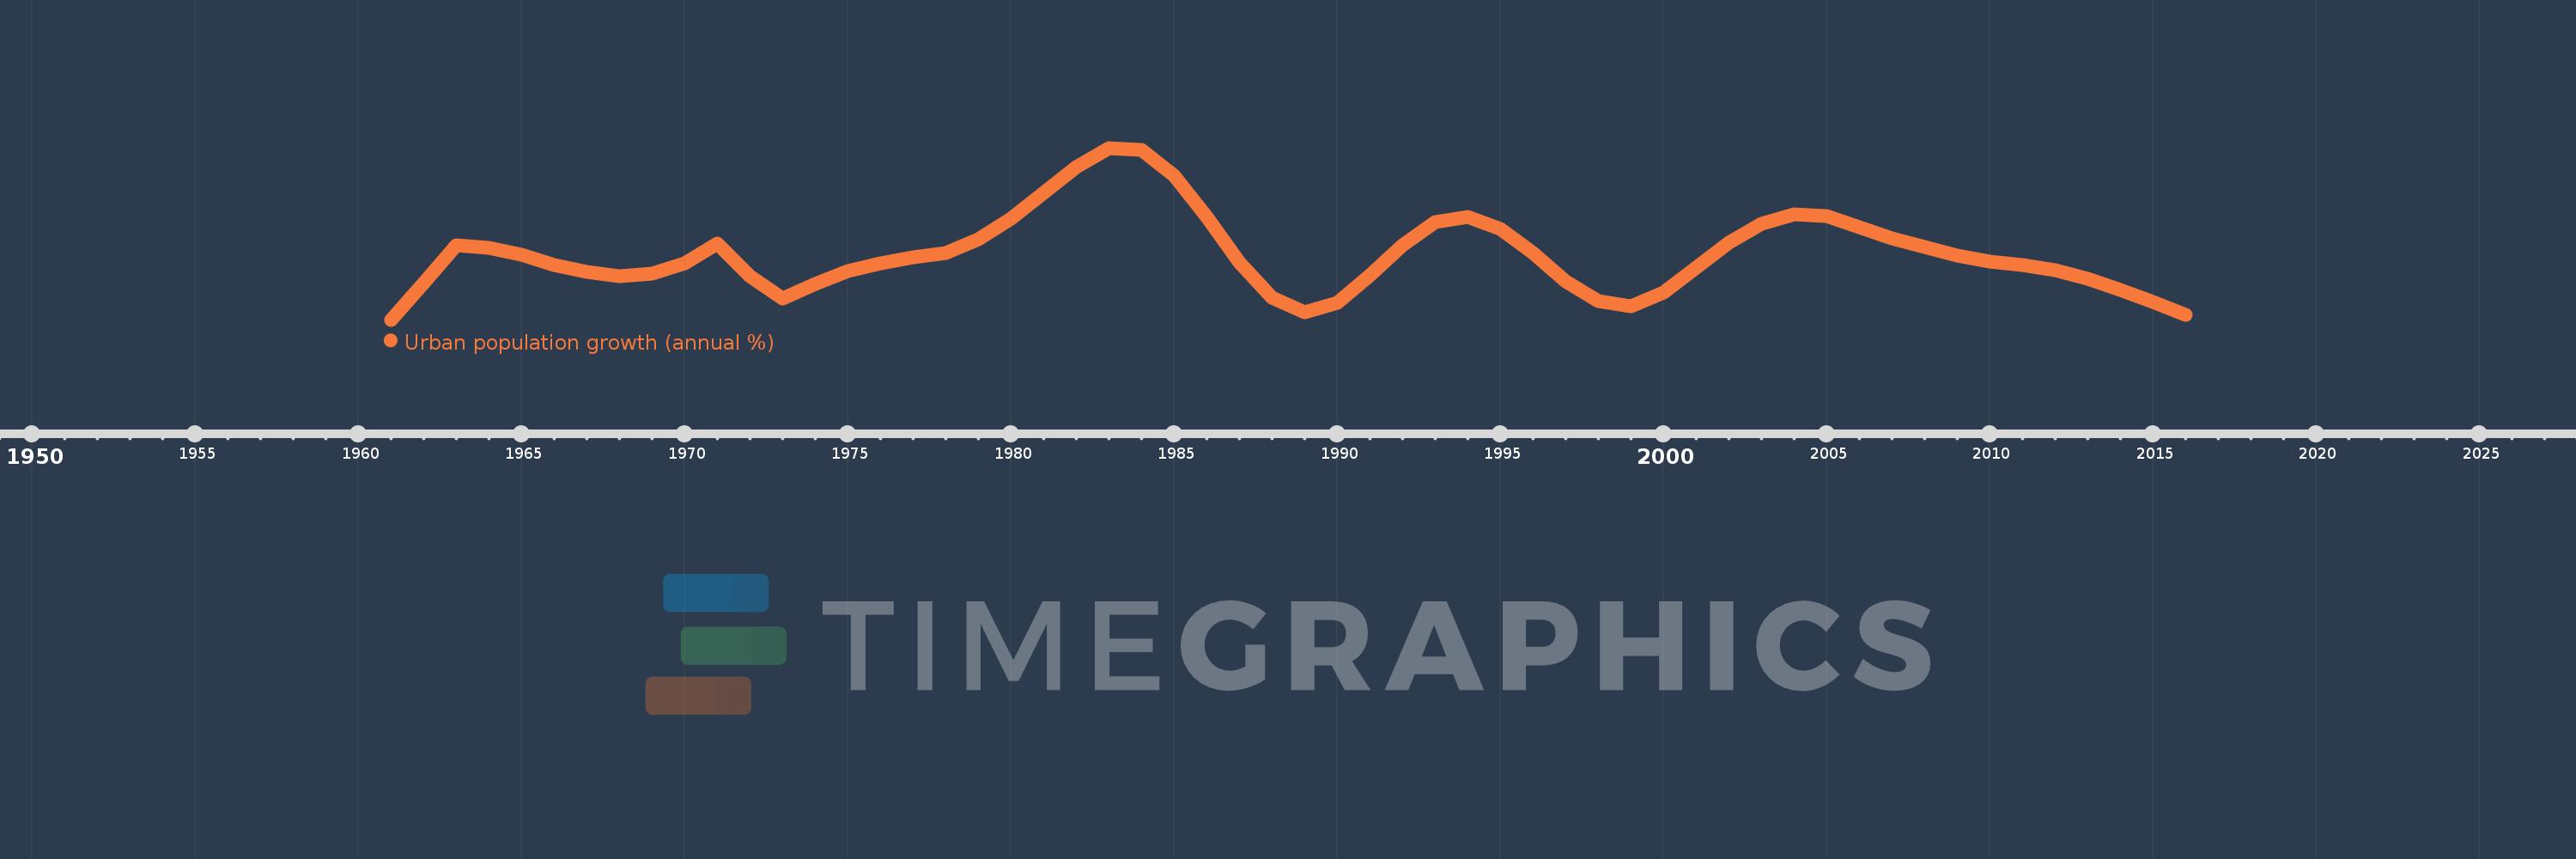
Urban population growth (annual %)
2016,2015,2014,2013,2012,2011,2010,2009,2008,2007,2006,2005,2004,2003,2002,2001,2000,1999,1998,1997,1996,1995,1994,1993,1992,1991,1990,1989,1988,1987,1986,1985,1984,1983,1982,1981,1980,1979,1978,1977,1976,1975,1974,1973,1972,1971,1970,1969,1968,1967,1966,1965,1964,1963,1962,1961
This statistics in other country:
AfghanistanAlbaniaAlgeriaAmerican SamoaAndorraAngolaAntigua and BarbudaArab WorldArgentinaArmeniaArubaAustraliaAustriaAzerbaijanBahamas, TheBahrainBangladeshBarbadosBelarusBelgiumBelizeBeninBermudaBhutanBoliviaBosnia and HerzegovinaBotswanaBrazilBritish Virgin IslandsBrunei DarussalamBulgariaBurkina FasoBurundiCabo VerdeCambodiaCameroonCanadaCaribbean small statesCayman IslandsCentral African RepublicCentral Europe and the BalticsChadChannel IslandsChileChinaColombiaComorosCongo, Dem. Rep.Congo, Rep.Costa RicaCote d'IvoireCroatiaCubaCuracaoCyprusCzech RepublicDenmarkDjiboutiDominicaDominican RepublicEarly-demographic dividendEast Asia & PacificEast Asia & Pacific (excluding high income)East Asia & Pacific (IDA & IBRD countries)EcuadorEgypt, Arab Rep.El SalvadorEquatorial GuineaEritreaEstoniaEthiopiaEuro areaEurope & Central AsiaEurope & Central Asia (excluding high income)Europe & Central Asia (IDA & IBRD countries)European UnionFaroe IslandsFijiFinlandFragile and conflict affected situationsFranceFrench PolynesiaGabonGambia, TheGeorgiaGermanyGhanaGibraltarGreeceGreenlandGrenadaGuamGuatemalaGuineaGuinea-BissauGuyanaHaitiHeavily indebted poor countries (HIPC)High incomeHondurasHong Kong SAR, ChinaHungaryIBRD onlyIcelandIDA & IBRD totalIDA blendIDA onlyIDA totalIndiaIndonesiaIran, Islamic Rep.IraqIrelandIsle of ManIsraelItalyJamaicaJapanJordanKazakhstanKenyaKiribatiKorea, Dem. People’s Rep.Korea, Rep.KuwaitKyrgyz RepublicLao PDRLate-demographic dividendLatin America & Caribbean Latin America & Caribbean (excluding high income)Latin America & the Caribbean (IDA & IBRD countries)LatviaLeast developed countries: UN classificationLebanonLesothoLiberiaLibyaLiechtensteinLithuaniaLow & middle incomeLow incomeLower middle incomeLuxembourgMacao SAR, ChinaMacedonia, FYRMadagascarMalawiMalaysiaMaldivesMaliMaltaMarshall IslandsMauritaniaMauritiusMexicoMicronesia, Fed. Sts.Middle East & North AfricaMiddle East & North Africa (excluding high income)Middle East & North Africa (IDA & IBRD countries)Middle incomeMoldovaMonacoMongoliaMontenegroMoroccoMozambiqueMyanmarNamibiaNauruNepalNetherlandsNew CaledoniaNew ZealandNicaraguaNigerNigeriaNorth AmericaNorthern Mariana IslandsNorwayOECD membersOmanOther small statesPacific island small statesPakistanPalauPanamaPapua New GuineaParaguayPeruPhilippinesPolandPortugalPost-demographic dividendPre-demographic dividendPuerto RicoQatarRomaniaRussian FederationRwandaSamoaSan MarinoSao Tome and PrincipeSaudi ArabiaSenegalSerbiaSeychellesSierra LeoneSingaporeSint Maarten (Dutch part)Slovak RepublicSloveniaSmall statesSolomon IslandsSomaliaSouth AfricaSouth AsiaSouth Asia (IDA & IBRD)South SudanSpainSri LankaSt. Kitts and NevisSt. LuciaSt. Vincent and the GrenadinesSub-Saharan Africa Sub-Saharan Africa (excluding high income)Sub-Saharan Africa (IDA & IBRD countries)SudanSurinameSwazilandSwedenSwitzerlandSyrian Arab RepublicTajikistanTanzaniaThailandTimor-LesteTogoTongaTrinidad and TobagoTunisiaTurkeyTurkmenistanTurks and Caicos IslandsTuvaluUgandaUkraineUnited Arab EmiratesUnited KingdomUnited StatesUpper middle incomeUruguayUzbekistanVanuatuVenezuela, RBVietnamVirgin Islands (U.S.)West Bank and GazaWorldYemen, Rep.ZambiaZimbabwe Timeline:
This timeline shows a graph from 1961 to 2016 of Angola. No data until 1960. Number of actual observations by date: 56.
Source name:
World Development Indicators
Source organization:
World Bank Staff estimates based on United Nations, World Urbanization Prospects.
Categories, topics:
Climate Change, Urban Development
Last updated:
apr 23, 2017
Indicators value changes by year
At the date of observation
Value
Absolute change
Change from previous value
jan 1, 1961
4.967
+4.967
0.0%
jan 1, 1962
5.233
+0.266
5.35%
jan 1, 1963
5.512
+0.279
5.33%
jan 1, 1964
5.491
-0.02
-0.37%
jan 1, 1965
5.444
-0.047
-0.86%
jan 1, 1966
5.37
-0.074
-1.37%
jan 1, 1967
5.315
-0.055
-1.02%
jan 1, 1968
5.284
-0.031
-0.59%
jan 1, 1969
5.305
+0.021
0.39%
jan 1, 1970
5.377
+0.072
1.36%
jan 1, 1971
5.521
+0.144
2.68%
jan 1, 1972
5.285
-0.236
-4.27%
jan 1, 1973
5.121
-0.165
-3.11%
jan 1, 1974
5.227
+0.106
2.08%
jan 1, 1975
5.323
+0.096
1.84%
jan 1, 1976
5.379
+0.055
1.04%
jan 1, 1977
5.423
+0.045
0.83%
jan 1, 1978
5.458
+0.035
0.64%
jan 1, 1979
5.553
+0.095
1.75%
jan 1, 1980
5.706
+0.153
2.75%
jan 1, 1981
5.892
+0.186
3.27%
jan 1, 1982
6.084
+0.192
3.26%
jan 1, 1983
6.223
+0.138
2.27%
jan 1, 1984
6.209
-0.013
-0.22%
jan 1, 1985
6.021
-0.188
-3.03%
jan 1, 1986
5.718
-0.303
-5.03%
jan 1, 1987
5.388
-0.33
-5.77%
jan 1, 1988
5.129
-0.26
-4.82%
jan 1, 1989
5.023
-0.106
-2.06%
jan 1, 1990
5.092
+0.069
1.38%
jan 1, 1991
5.29
+0.198
3.88%
jan 1, 1992
5.514
+0.224
4.24%
jan 1, 1993
5.684
+0.17
3.08%
jan 1, 1994
5.721
+0.037
0.66%
jan 1, 1995
5.632
-0.089
-1.56%
jan 1, 1996
5.452
-0.18
-3.2%
jan 1, 1997
5.249
-0.203
-3.72%
jan 1, 1998
5.103
-0.146
-2.78%
jan 1, 1999
5.066
-0.037
-0.72%
jan 1, 2000
5.167
+0.1
1.98%
jan 1, 2001
5.347
+0.181
3.5%
jan 1, 2002
5.529
+0.181
3.39%
jan 1, 2003
5.67
+0.141
2.56%
jan 1, 2004
5.736
+0.066
1.16%
jan 1, 2005
5.725
-0.011
-0.18%
jan 1, 2006
5.643
-0.083
-1.44%
jan 1, 2007
5.563
-0.079
-1.41%
jan 1, 2008
5.496
-0.068
-1.22%
jan 1, 2009
5.439
-0.057
-1.03%
jan 1, 2010
5.39
-0.049
-0.9%
jan 1, 2011
5.364
-0.026
-0.48%
jan 1, 2012
5.33
-0.034
-0.63%
jan 1, 2013
5.266
-0.064
-1.2%
jan 1, 2014
5.185
-0.081
-1.54%
jan 1, 2015
5.098
-0.087
-1.69%
jan 1, 2016
5.004
-0.094
-1.84%
Ranking of countries by current statistics by years


Comments: