29
/
en
AIzaSyAYiBZKx7MnpbEhh9jyipgxe19OcubqV5w
April 1, 2024
45787
Low & middle income
LMY
false
2
1
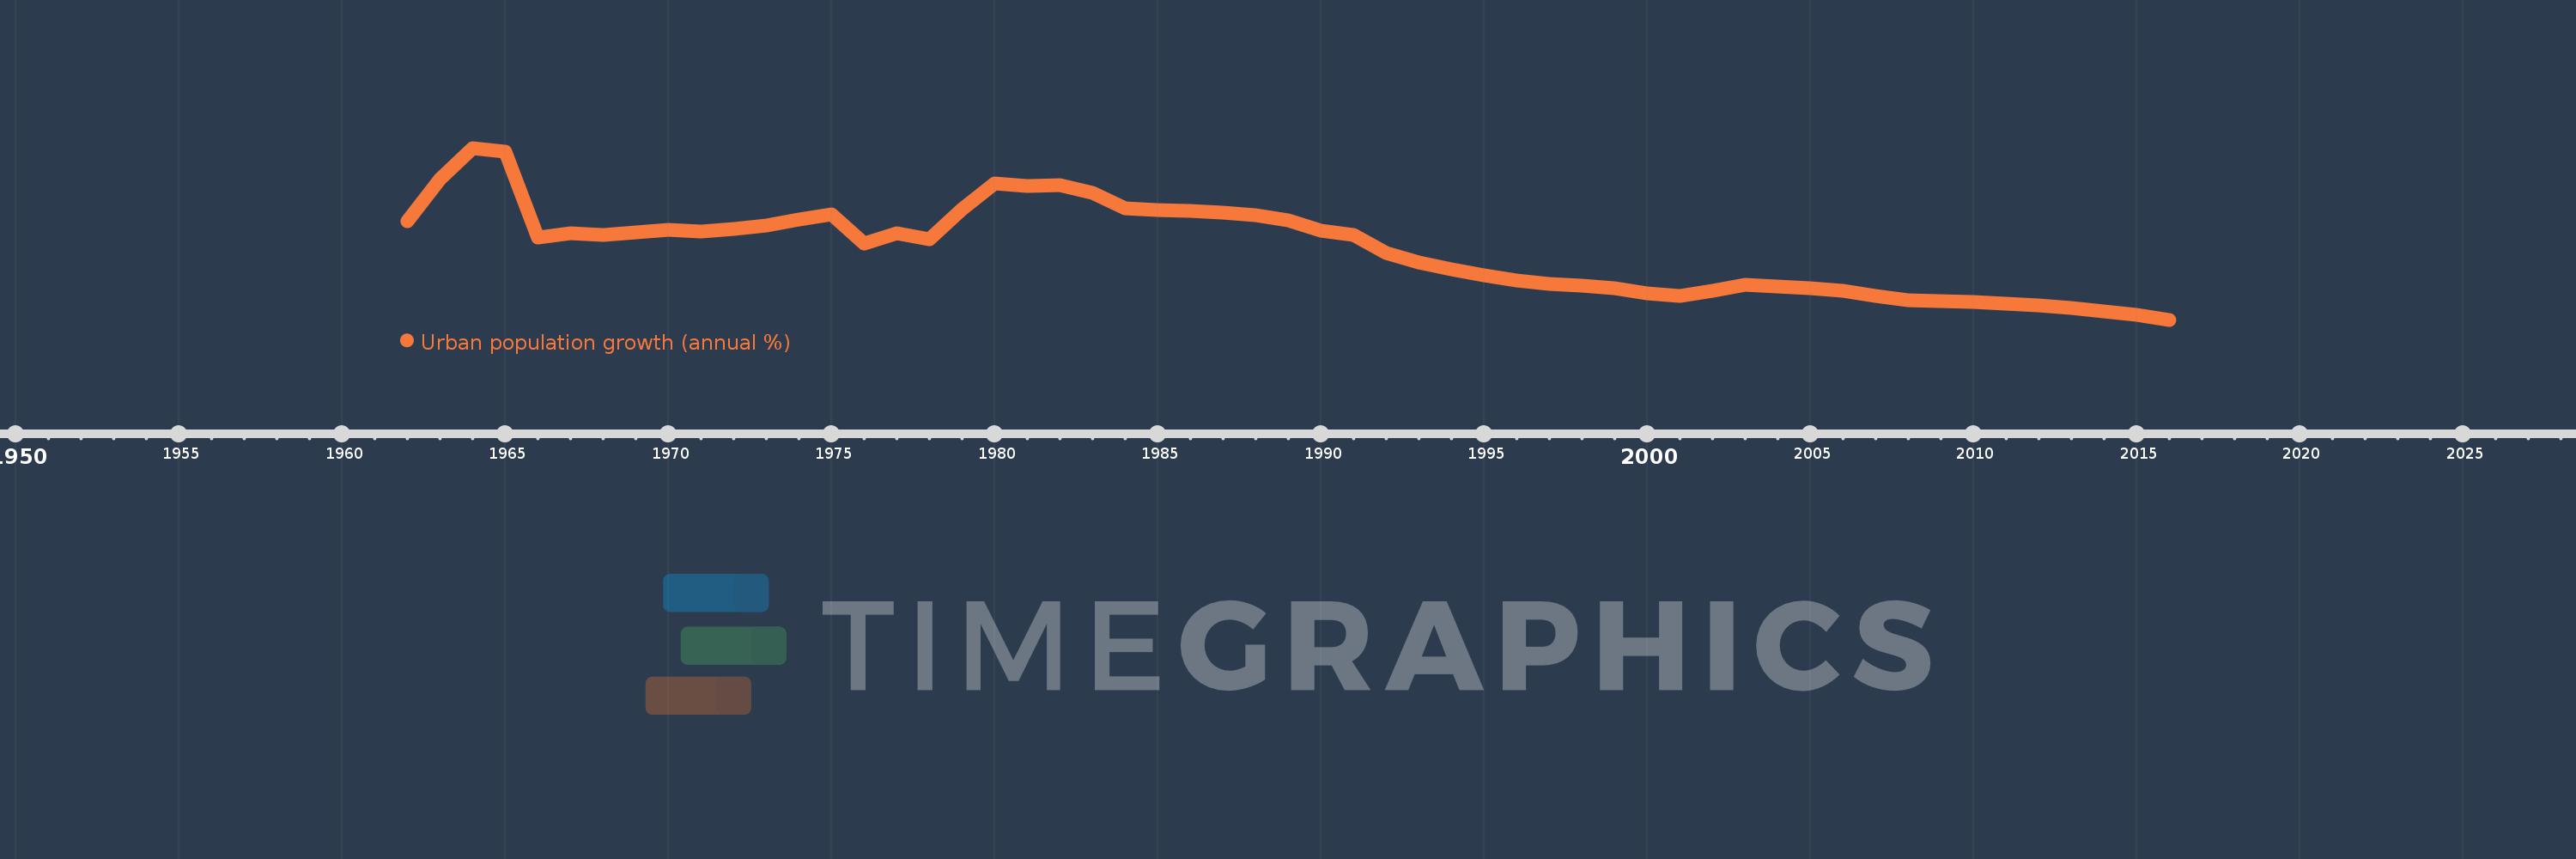
Urban population growth (annual %)
2016,2015,2014,2013,2012,2011,2010,2009,2008,2007,2006,2005,2004,2003,2002,2001,2000,1999,1998,1997,1996,1995,1994,1993,1992,1991,1990,1989,1988,1987,1986,1985,1984,1983,1982,1981,1980,1979,1978,1977,1976,1975,1974,1973,1972,1971,1970,1969,1968,1967,1966,1965,1964,1963,1962
This statistics in other country:
AfghanistanAlbaniaAlgeriaAmerican SamoaAndorraAngolaAntigua and BarbudaArab WorldArgentinaArmeniaArubaAustraliaAustriaAzerbaijanBahamas, TheBahrainBangladeshBarbadosBelarusBelgiumBelizeBeninBermudaBhutanBoliviaBosnia and HerzegovinaBotswanaBrazilBritish Virgin IslandsBrunei DarussalamBulgariaBurkina FasoBurundiCabo VerdeCambodiaCameroonCanadaCaribbean small statesCayman IslandsCentral African RepublicCentral Europe and the BalticsChadChannel IslandsChileChinaColombiaComorosCongo, Dem. Rep.Congo, Rep.Costa RicaCote d'IvoireCroatiaCubaCuracaoCyprusCzech RepublicDenmarkDjiboutiDominicaDominican RepublicEarly-demographic dividendEast Asia & PacificEast Asia & Pacific (excluding high income)East Asia & Pacific (IDA & IBRD countries)EcuadorEgypt, Arab Rep.El SalvadorEquatorial GuineaEritreaEstoniaEthiopiaEuro areaEurope & Central AsiaEurope & Central Asia (excluding high income)Europe & Central Asia (IDA & IBRD countries)European UnionFaroe IslandsFijiFinlandFragile and conflict affected situationsFranceFrench PolynesiaGabonGambia, TheGeorgiaGermanyGhanaGibraltarGreeceGreenlandGrenadaGuamGuatemalaGuineaGuinea-BissauGuyanaHaitiHeavily indebted poor countries (HIPC)High incomeHondurasHong Kong SAR, ChinaHungaryIBRD onlyIcelandIDA & IBRD totalIDA blendIDA onlyIDA totalIndiaIndonesiaIran, Islamic Rep.IraqIrelandIsle of ManIsraelItalyJamaicaJapanJordanKazakhstanKenyaKiribatiKorea, Dem. People’s Rep.Korea, Rep.KuwaitKyrgyz RepublicLao PDRLate-demographic dividendLatin America & Caribbean Latin America & Caribbean (excluding high income)Latin America & the Caribbean (IDA & IBRD countries)LatviaLeast developed countries: UN classificationLebanonLesothoLiberiaLibyaLiechtensteinLithuaniaLow & middle incomeLow incomeLower middle incomeLuxembourgMacao SAR, ChinaMacedonia, FYRMadagascarMalawiMalaysiaMaldivesMaliMaltaMarshall IslandsMauritaniaMauritiusMexicoMicronesia, Fed. Sts.Middle East & North AfricaMiddle East & North Africa (excluding high income)Middle East & North Africa (IDA & IBRD countries)Middle incomeMoldovaMonacoMongoliaMontenegroMoroccoMozambiqueMyanmarNamibiaNauruNepalNetherlandsNew CaledoniaNew ZealandNicaraguaNigerNigeriaNorth AmericaNorthern Mariana IslandsNorwayOECD membersOmanOther small statesPacific island small statesPakistanPalauPanamaPapua New GuineaParaguayPeruPhilippinesPolandPortugalPost-demographic dividendPre-demographic dividendPuerto RicoQatarRomaniaRussian FederationRwandaSamoaSan MarinoSao Tome and PrincipeSaudi ArabiaSenegalSerbiaSeychellesSierra LeoneSingaporeSint Maarten (Dutch part)Slovak RepublicSloveniaSmall statesSolomon IslandsSomaliaSouth AfricaSouth AsiaSouth Asia (IDA & IBRD)South SudanSpainSri LankaSt. Kitts and NevisSt. LuciaSt. Vincent and the GrenadinesSub-Saharan Africa Sub-Saharan Africa (excluding high income)Sub-Saharan Africa (IDA & IBRD countries)SudanSurinameSwazilandSwedenSwitzerlandSyrian Arab RepublicTajikistanTanzaniaThailandTimor-LesteTogoTongaTrinidad and TobagoTunisiaTurkeyTurkmenistanTurks and Caicos IslandsTuvaluUgandaUkraineUnited Arab EmiratesUnited KingdomUnited StatesUpper middle incomeUruguayUzbekistanVanuatuVenezuela, RBVietnamVirgin Islands (U.S.)West Bank and GazaWorldYemen, Rep.ZambiaZimbabwe Timeline:
This timeline shows a graph from 1962 to 2016 of Low & middle income. No data until 1961. Number of actual observations by date: 55.
Source name:
World Development Indicators
Source organization:
World Bank Staff estimates based on United Nations, World Urbanization Prospects.
Categories, topics:
Climate Change, Urban Development
Last updated:
apr 23, 2017
Indicators value changes by year
At the date of observation
Value
Absolute change
Change from previous value
jan 1, 1962
3.469
+3.469
0.0%
jan 1, 1963
3.899
+0.429
12.37%
jan 1, 1964
4.225
+0.326
8.36%
jan 1, 1965
4.191
-0.034
-0.8%
jan 1, 1966
3.295
-0.895
-21.36%
jan 1, 1967
3.341
+0.046
1.39%
jan 1, 1968
3.327
-0.014
-0.42%
jan 1, 1969
3.346
+0.019
0.56%
jan 1, 1970
3.374
+0.028
0.83%
jan 1, 1971
3.36
-0.014
-0.42%
jan 1, 1972
3.383
+0.023
0.68%
jan 1, 1973
3.417
+0.034
1.01%
jan 1, 1974
3.479
+0.062
1.82%
jan 1, 1975
3.536
+0.056
1.62%
jan 1, 1976
3.233
-0.303
-8.56%
jan 1, 1977
3.343
+0.11
3.4%
jan 1, 1978
3.281
-0.062
-1.84%
jan 1, 1979
3.589
+0.308
9.38%
jan 1, 1980
3.856
+0.267
7.45%
jan 1, 1981
3.834
-0.022
-0.58%
jan 1, 1982
3.843
+0.009
0.23%
jan 1, 1983
3.756
-0.086
-2.25%
jan 1, 1984
3.599
-0.157
-4.18%
jan 1, 1985
3.581
-0.019
-0.52%
jan 1, 1986
3.571
-0.01
-0.28%
jan 1, 1987
3.557
-0.014
-0.4%
jan 1, 1988
3.529
-0.027
-0.77%
jan 1, 1989
3.478
-0.051
-1.46%
jan 1, 1990
3.366
-0.112
-3.23%
jan 1, 1991
3.324
-0.041
-1.22%
jan 1, 1992
3.14
-0.184
-5.54%
jan 1, 1993
3.038
-0.103
-3.26%
jan 1, 1994
2.963
-0.075
-2.45%
jan 1, 1995
2.902
-0.061
-2.06%
jan 1, 1996
2.855
-0.047
-1.63%
jan 1, 1997
2.818
-0.038
-1.31%
jan 1, 1998
2.799
-0.019
-0.67%
jan 1, 1999
2.767
-0.032
-1.15%
jan 1, 2000
2.718
-0.049
-1.78%
jan 1, 2001
2.687
-0.03
-1.1%
jan 1, 2002
2.746
+0.059
2.2%
jan 1, 2003
2.805
+0.059
2.13%
jan 1, 2004
2.791
-0.014
-0.5%
jan 1, 2005
2.77
-0.021
-0.76%
jan 1, 2006
2.746
-0.024
-0.86%
jan 1, 2007
2.693
-0.053
-1.94%
jan 1, 2008
2.646
-0.047
-1.74%
jan 1, 2009
2.639
-0.007
-0.25%
jan 1, 2010
2.627
-0.012
-0.45%
jan 1, 2011
2.611
-0.017
-0.63%
jan 1, 2012
2.596
-0.015
-0.58%
jan 1, 2013
2.566
-0.029
-1.13%
jan 1, 2014
2.531
-0.035
-1.36%
jan 1, 2015
2.492
-0.039
-1.56%
jan 1, 2016
2.444
-0.048
-1.94%
Ranking of countries by current statistics by years


Comments: