29
/
en
AIzaSyAYiBZKx7MnpbEhh9jyipgxe19OcubqV5w
April 1, 2024
234301
Sao Tome and Principe
STP
true
2
1
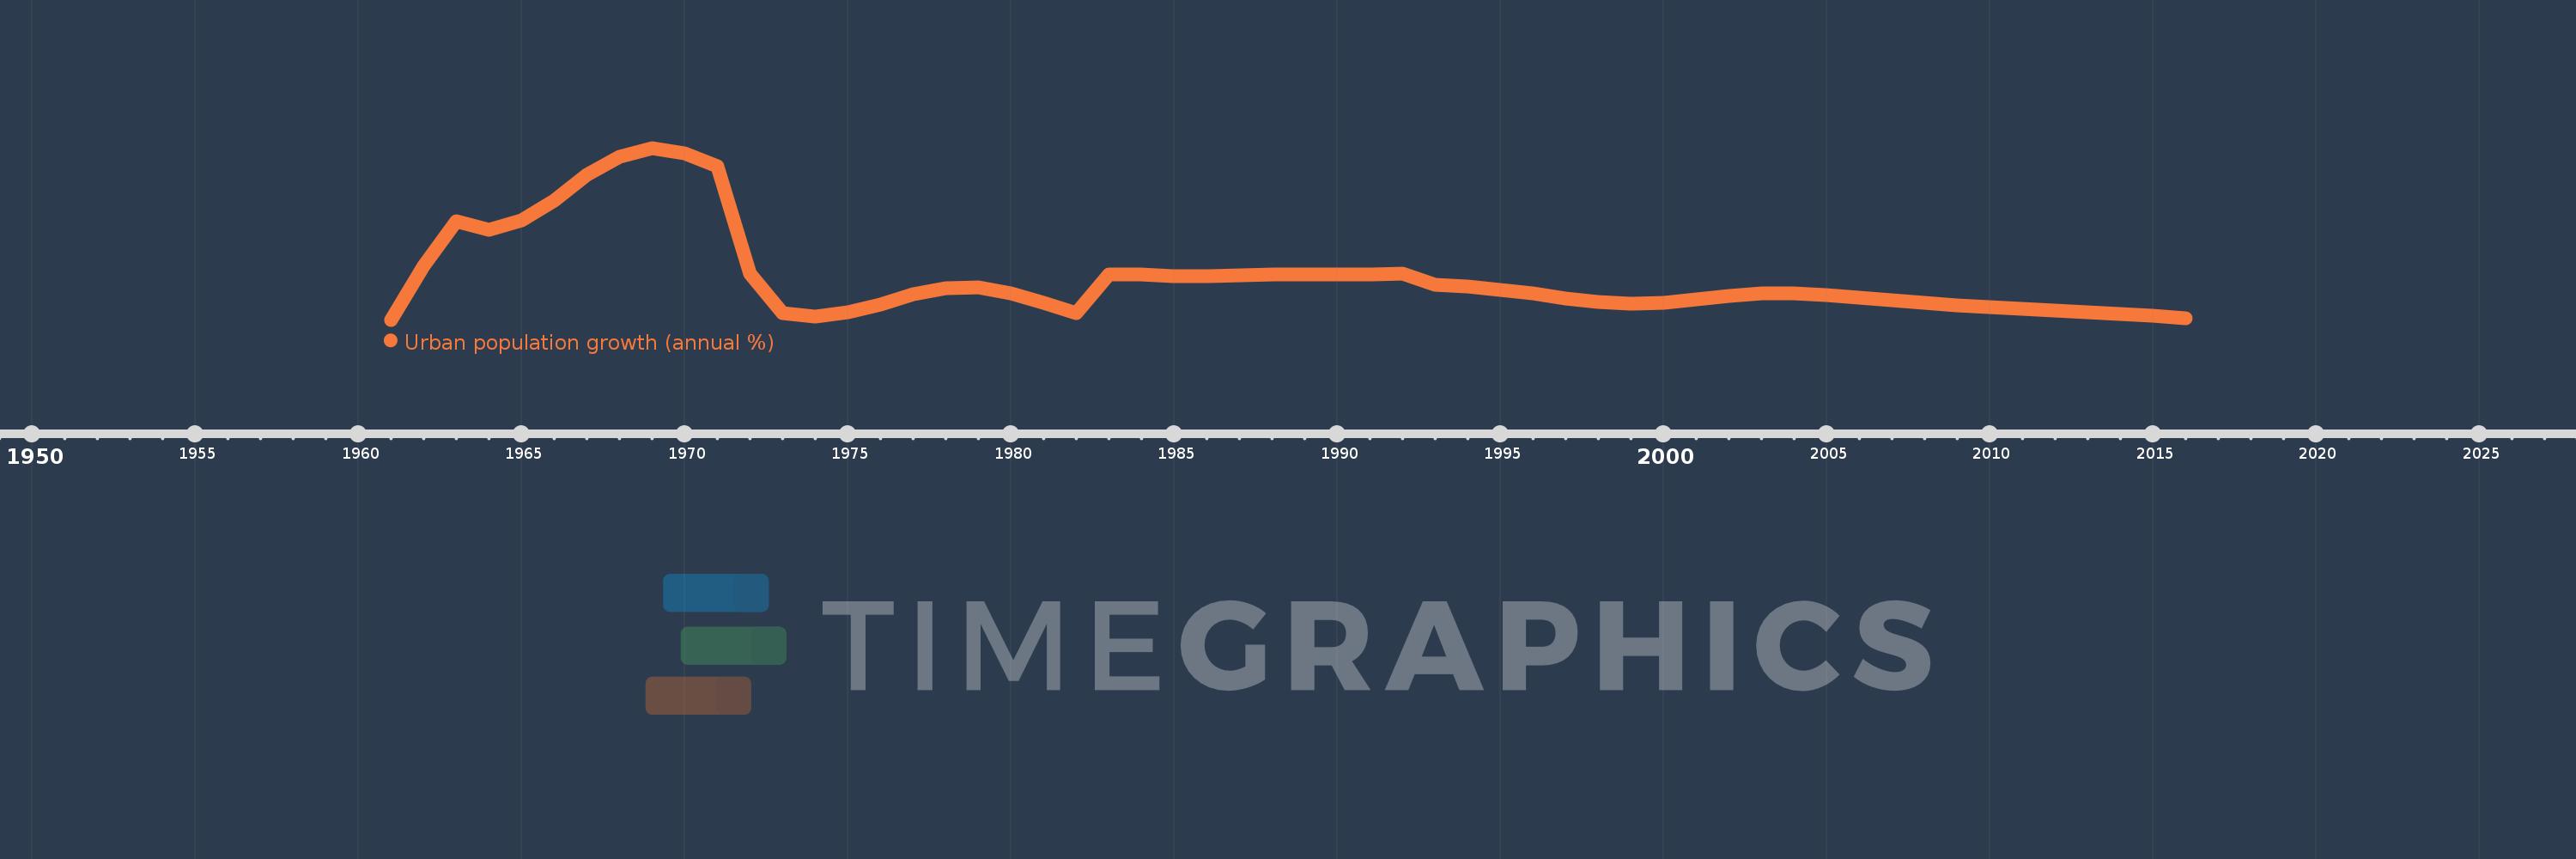
Urban population growth (annual %)
2016,2015,2014,2013,2012,2011,2010,2009,2008,2007,2006,2005,2004,2003,2002,2001,2000,1999,1998,1997,1996,1995,1994,1993,1992,1991,1990,1989,1988,1987,1986,1985,1984,1983,1982,1981,1980,1979,1978,1977,1976,1975,1974,1973,1972,1971,1970,1969,1968,1967,1966,1965,1964,1963,1962,1961
This statistics in other country:
AfghanistanAlbaniaAlgeriaAmerican SamoaAndorraAngolaAntigua and BarbudaArab WorldArgentinaArmeniaArubaAustraliaAustriaAzerbaijanBahamas, TheBahrainBangladeshBarbadosBelarusBelgiumBelizeBeninBermudaBhutanBoliviaBosnia and HerzegovinaBotswanaBrazilBritish Virgin IslandsBrunei DarussalamBulgariaBurkina FasoBurundiCabo VerdeCambodiaCameroonCanadaCaribbean small statesCayman IslandsCentral African RepublicCentral Europe and the BalticsChadChannel IslandsChileChinaColombiaComorosCongo, Dem. Rep.Congo, Rep.Costa RicaCote d'IvoireCroatiaCubaCuracaoCyprusCzech RepublicDenmarkDjiboutiDominicaDominican RepublicEarly-demographic dividendEast Asia & PacificEast Asia & Pacific (excluding high income)East Asia & Pacific (IDA & IBRD countries)EcuadorEgypt, Arab Rep.El SalvadorEquatorial GuineaEritreaEstoniaEthiopiaEuro areaEurope & Central AsiaEurope & Central Asia (excluding high income)Europe & Central Asia (IDA & IBRD countries)European UnionFaroe IslandsFijiFinlandFragile and conflict affected situationsFranceFrench PolynesiaGabonGambia, TheGeorgiaGermanyGhanaGibraltarGreeceGreenlandGrenadaGuamGuatemalaGuineaGuinea-BissauGuyanaHaitiHeavily indebted poor countries (HIPC)High incomeHondurasHong Kong SAR, ChinaHungaryIBRD onlyIcelandIDA & IBRD totalIDA blendIDA onlyIDA totalIndiaIndonesiaIran, Islamic Rep.IraqIrelandIsle of ManIsraelItalyJamaicaJapanJordanKazakhstanKenyaKiribatiKorea, Dem. People’s Rep.Korea, Rep.KuwaitKyrgyz RepublicLao PDRLate-demographic dividendLatin America & Caribbean Latin America & Caribbean (excluding high income)Latin America & the Caribbean (IDA & IBRD countries)LatviaLeast developed countries: UN classificationLebanonLesothoLiberiaLibyaLiechtensteinLithuaniaLow & middle incomeLow incomeLower middle incomeLuxembourgMacao SAR, ChinaMacedonia, FYRMadagascarMalawiMalaysiaMaldivesMaliMaltaMarshall IslandsMauritaniaMauritiusMexicoMicronesia, Fed. Sts.Middle East & North AfricaMiddle East & North Africa (excluding high income)Middle East & North Africa (IDA & IBRD countries)Middle incomeMoldovaMonacoMongoliaMontenegroMoroccoMozambiqueMyanmarNamibiaNauruNepalNetherlandsNew CaledoniaNew ZealandNicaraguaNigerNigeriaNorth AmericaNorthern Mariana IslandsNorwayOECD membersOmanOther small statesPacific island small statesPakistanPalauPanamaPapua New GuineaParaguayPeruPhilippinesPolandPortugalPost-demographic dividendPre-demographic dividendPuerto RicoQatarRomaniaRussian FederationRwandaSamoaSan MarinoSao Tome and PrincipeSaudi ArabiaSenegalSerbiaSeychellesSierra LeoneSingaporeSint Maarten (Dutch part)Slovak RepublicSloveniaSmall statesSolomon IslandsSomaliaSouth AfricaSouth AsiaSouth Asia (IDA & IBRD)South SudanSpainSri LankaSt. Kitts and NevisSt. LuciaSt. Vincent and the GrenadinesSub-Saharan Africa Sub-Saharan Africa (excluding high income)Sub-Saharan Africa (IDA & IBRD countries)SudanSurinameSwazilandSwedenSwitzerlandSyrian Arab RepublicTajikistanTanzaniaThailandTimor-LesteTogoTongaTrinidad and TobagoTunisiaTurkeyTurkmenistanTurks and Caicos IslandsTuvaluUgandaUkraineUnited Arab EmiratesUnited KingdomUnited StatesUpper middle incomeUruguayUzbekistanVanuatuVenezuela, RBVietnamVirgin Islands (U.S.)West Bank and GazaWorldYemen, Rep.ZambiaZimbabwe Timeline:
This timeline shows a graph from 1961 to 2016 of Sao Tome and Principe. No data until 1960. Number of actual observations by date: 56.
Source name:
World Development Indicators
Source organization:
World Bank Staff estimates based on United Nations, World Urbanization Prospects.
Categories, topics:
Climate Change, Urban Development
Last updated:
apr 23, 2017
Indicators value changes by year
At the date of observation
Value
Absolute change
Change from previous value
jan 1, 1961
2.958
+2.958
0.0%
jan 1, 1962
4.903
+1.945
65.77%
jan 1, 1963
6.513
+1.61
32.84%
jan 1, 1964
6.212
-0.301
-4.62%
jan 1, 1965
6.551
+0.338
5.45%
jan 1, 1966
7.285
+0.735
11.21%
jan 1, 1967
8.2
+0.915
12.56%
jan 1, 1968
8.874
+0.674
8.22%
jan 1, 1969
9.183
+0.309
3.48%
jan 1, 1970
8.998
-0.185
-2.01%
jan 1, 1971
8.52
-0.478
-5.32%
jan 1, 1972
4.614
-3.906
-45.84%
jan 1, 1973
3.19
-1.424
-30.86%
jan 1, 1974
3.059
-0.131
-4.12%
jan 1, 1975
3.218
+0.159
5.21%
jan 1, 1976
3.524
+0.306
9.51%
jan 1, 1977
3.873
+0.349
9.89%
jan 1, 1978
4.093
+0.22
5.69%
jan 1, 1979
4.125
+0.032
0.79%
jan 1, 1980
3.926
-0.199
-4.83%
jan 1, 1981
3.573
-0.353
-8.98%
jan 1, 1982
3.191
-0.382
-10.69%
jan 1, 1983
4.605
+1.414
44.3%
jan 1, 1984
4.603
-0.003
-0.06%
jan 1, 1985
4.525
-0.078
-1.69%
jan 1, 1986
4.535
+0.01
0.22%
jan 1, 1987
4.581
+0.046
1.01%
jan 1, 1988
4.584
+0.003
0.07%
jan 1, 1989
4.6
+0.016
0.35%
jan 1, 1990
4.601
+0.001
0.01%
jan 1, 1991
4.596
-0.005
-0.1%
jan 1, 1992
4.616
+0.02
0.43%
jan 1, 1993
4.233
-0.383
-8.29%
jan 1, 1994
4.154
-0.08
-1.89%
jan 1, 1995
4.048
-0.106
-2.55%
jan 1, 1996
3.898
-0.149
-3.69%
jan 1, 1997
3.733
-0.165
-4.24%
jan 1, 1998
3.591
-0.142
-3.8%
jan 1, 1999
3.536
-0.056
-1.55%
jan 1, 2000
3.581
+0.045
1.27%
jan 1, 2001
3.692
+0.111
3.11%
jan 1, 2002
3.817
+0.125
3.39%
jan 1, 2003
3.911
+0.094
2.45%
jan 1, 2004
3.915
+0.005
0.12%
jan 1, 2005
3.857
-0.059
-1.5%
jan 1, 2006
3.758
-0.098
-2.55%
jan 1, 2007
3.653
-0.106
-2.81%
jan 1, 2008
3.562
-0.091
-2.49%
jan 1, 2009
3.48
-0.082
-2.3%
jan 1, 2010
3.412
-0.067
-1.93%
jan 1, 2011
3.353
-0.06
-1.75%
jan 1, 2012
3.292
-0.06
-1.8%
jan 1, 2013
3.231
-0.062
-1.87%
jan 1, 2014
3.164
-0.067
-2.07%
jan 1, 2015
3.095
-0.07
-2.2%
jan 1, 2016
3.022
-0.073
-2.35%
Ranking of countries by current statistics by years


Comments: