29
/
en
AIzaSyAYiBZKx7MnpbEhh9jyipgxe19OcubqV5w
April 1, 2024
211244
Nicaragua
NIC
true
2
1
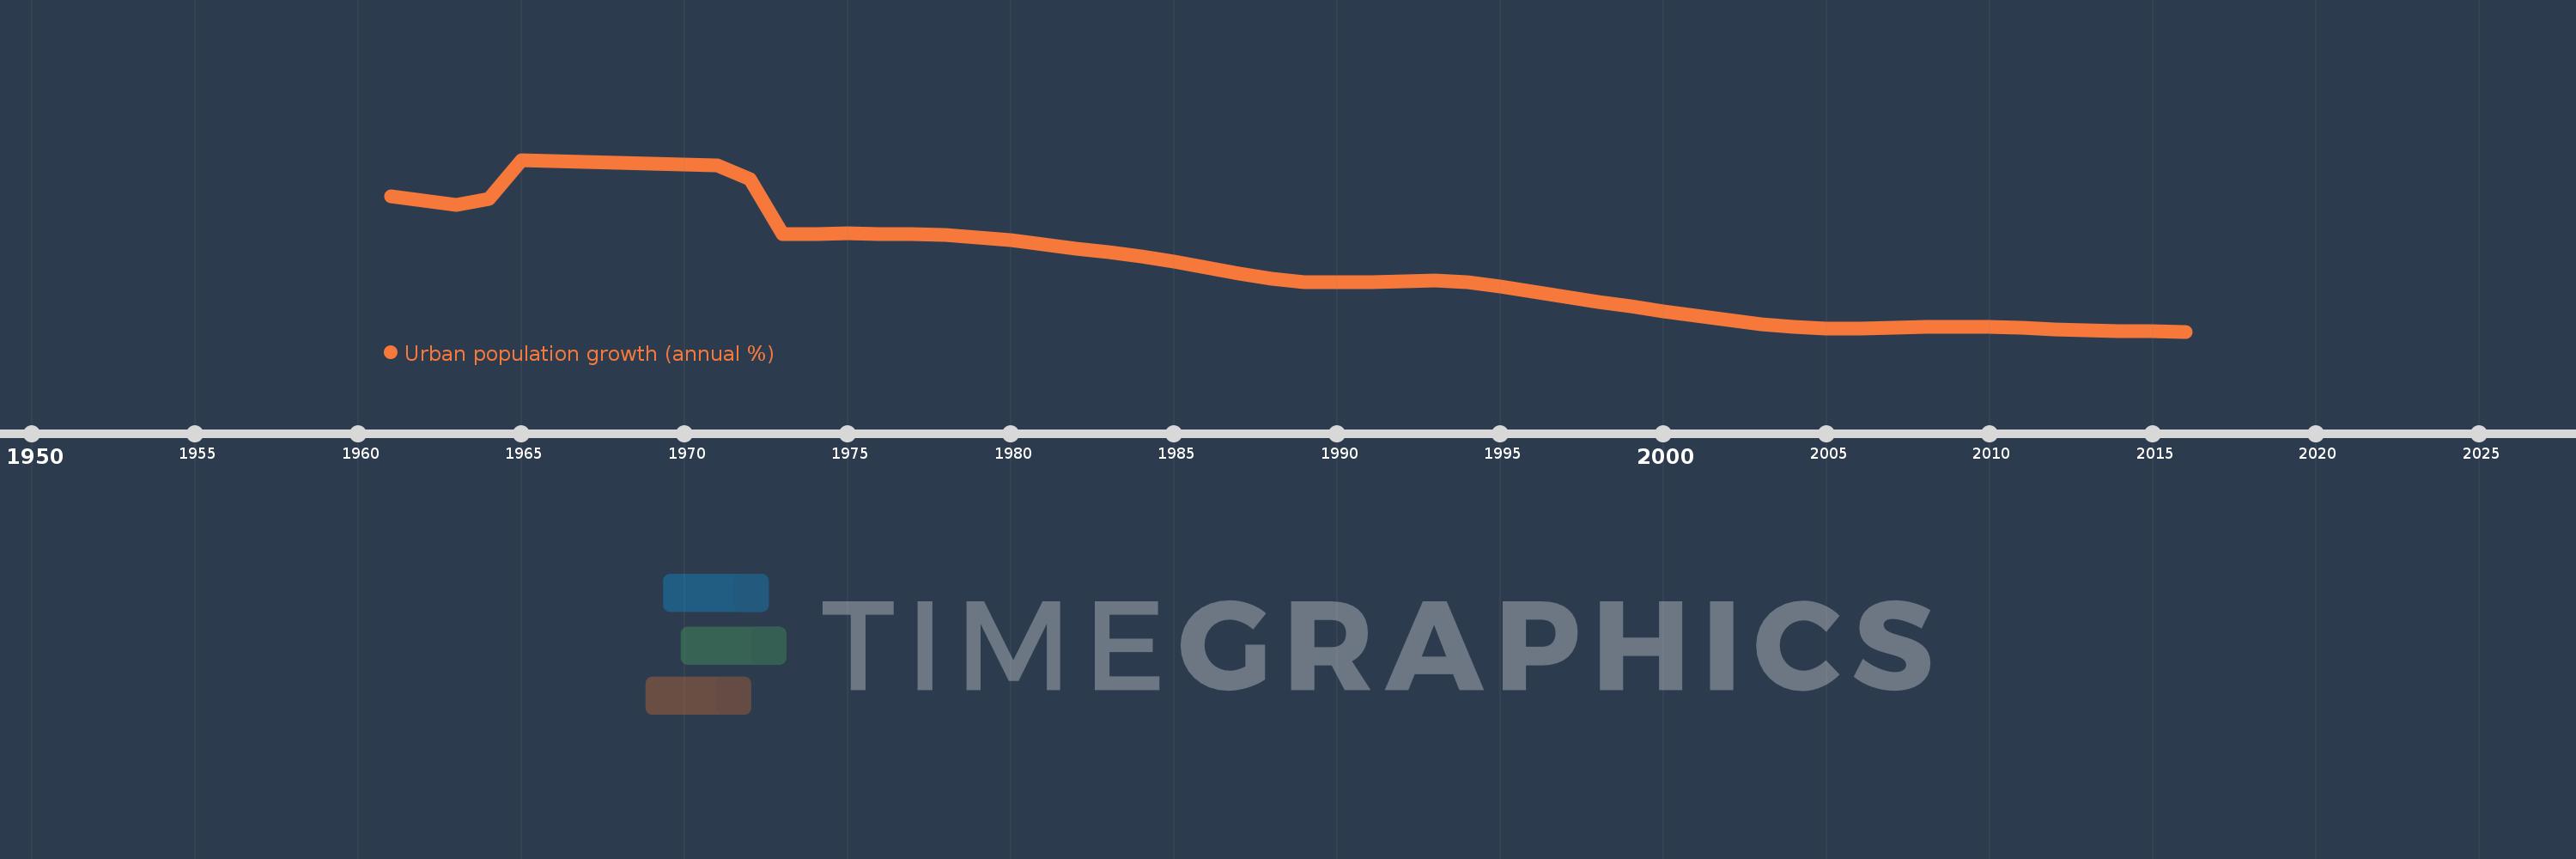
Urban population growth (annual %)
2016,2015,2014,2013,2012,2011,2010,2009,2008,2007,2006,2005,2004,2003,2002,2001,2000,1999,1998,1997,1996,1995,1994,1993,1992,1991,1990,1989,1988,1987,1986,1985,1984,1983,1982,1981,1980,1979,1978,1977,1976,1975,1974,1973,1972,1971,1970,1969,1968,1967,1966,1965,1964,1963,1962,1961
This statistics in other country:
AfghanistanAlbaniaAlgeriaAmerican SamoaAndorraAngolaAntigua and BarbudaArab WorldArgentinaArmeniaArubaAustraliaAustriaAzerbaijanBahamas, TheBahrainBangladeshBarbadosBelarusBelgiumBelizeBeninBermudaBhutanBoliviaBosnia and HerzegovinaBotswanaBrazilBritish Virgin IslandsBrunei DarussalamBulgariaBurkina FasoBurundiCabo VerdeCambodiaCameroonCanadaCaribbean small statesCayman IslandsCentral African RepublicCentral Europe and the BalticsChadChannel IslandsChileChinaColombiaComorosCongo, Dem. Rep.Congo, Rep.Costa RicaCote d'IvoireCroatiaCubaCuracaoCyprusCzech RepublicDenmarkDjiboutiDominicaDominican RepublicEarly-demographic dividendEast Asia & PacificEast Asia & Pacific (excluding high income)East Asia & Pacific (IDA & IBRD countries)EcuadorEgypt, Arab Rep.El SalvadorEquatorial GuineaEritreaEstoniaEthiopiaEuro areaEurope & Central AsiaEurope & Central Asia (excluding high income)Europe & Central Asia (IDA & IBRD countries)European UnionFaroe IslandsFijiFinlandFragile and conflict affected situationsFranceFrench PolynesiaGabonGambia, TheGeorgiaGermanyGhanaGibraltarGreeceGreenlandGrenadaGuamGuatemalaGuineaGuinea-BissauGuyanaHaitiHeavily indebted poor countries (HIPC)High incomeHondurasHong Kong SAR, ChinaHungaryIBRD onlyIcelandIDA & IBRD totalIDA blendIDA onlyIDA totalIndiaIndonesiaIran, Islamic Rep.IraqIrelandIsle of ManIsraelItalyJamaicaJapanJordanKazakhstanKenyaKiribatiKorea, Dem. People’s Rep.Korea, Rep.KuwaitKyrgyz RepublicLao PDRLate-demographic dividendLatin America & Caribbean Latin America & Caribbean (excluding high income)Latin America & the Caribbean (IDA & IBRD countries)LatviaLeast developed countries: UN classificationLebanonLesothoLiberiaLibyaLiechtensteinLithuaniaLow & middle incomeLow incomeLower middle incomeLuxembourgMacao SAR, ChinaMacedonia, FYRMadagascarMalawiMalaysiaMaldivesMaliMaltaMarshall IslandsMauritaniaMauritiusMexicoMicronesia, Fed. Sts.Middle East & North AfricaMiddle East & North Africa (excluding high income)Middle East & North Africa (IDA & IBRD countries)Middle incomeMoldovaMonacoMongoliaMontenegroMoroccoMozambiqueMyanmarNamibiaNauruNepalNetherlandsNew CaledoniaNew ZealandNicaraguaNigerNigeriaNorth AmericaNorthern Mariana IslandsNorwayOECD membersOmanOther small statesPacific island small statesPakistanPalauPanamaPapua New GuineaParaguayPeruPhilippinesPolandPortugalPost-demographic dividendPre-demographic dividendPuerto RicoQatarRomaniaRussian FederationRwandaSamoaSan MarinoSao Tome and PrincipeSaudi ArabiaSenegalSerbiaSeychellesSierra LeoneSingaporeSint Maarten (Dutch part)Slovak RepublicSloveniaSmall statesSolomon IslandsSomaliaSouth AfricaSouth AsiaSouth Asia (IDA & IBRD)South SudanSpainSri LankaSt. Kitts and NevisSt. LuciaSt. Vincent and the GrenadinesSub-Saharan Africa Sub-Saharan Africa (excluding high income)Sub-Saharan Africa (IDA & IBRD countries)SudanSurinameSwazilandSwedenSwitzerlandSyrian Arab RepublicTajikistanTanzaniaThailandTimor-LesteTogoTongaTrinidad and TobagoTunisiaTurkeyTurkmenistanTurks and Caicos IslandsTuvaluUgandaUkraineUnited Arab EmiratesUnited KingdomUnited StatesUpper middle incomeUruguayUzbekistanVanuatuVenezuela, RBVietnamVirgin Islands (U.S.)West Bank and GazaWorldYemen, Rep.ZambiaZimbabwe Timeline:
This timeline shows a graph from 1961 to 2016 of Nicaragua. No data until 1960. Number of actual observations by date: 56.
Source name:
World Development Indicators
Source organization:
World Bank Staff estimates based on United Nations, World Urbanization Prospects.
Categories, topics:
Climate Change, Urban Development
Last updated:
apr 23, 2017
Indicators value changes by year
At the date of observation
Value
Absolute change
Change from previous value
jan 1, 1961
4.306
+4.306
0.0%
jan 1, 1962
4.219
-0.087
-2.02%
jan 1, 1963
4.142
-0.076
-1.81%
jan 1, 1964
4.264
+0.122
2.94%
jan 1, 1965
5.019
+0.754
17.69%
jan 1, 1966
4.993
-0.026
-0.51%
jan 1, 1967
4.979
-0.014
-0.28%
jan 1, 1968
4.956
-0.023
-0.46%
jan 1, 1969
4.94
-0.016
-0.33%
jan 1, 1970
4.923
-0.017
-0.34%
jan 1, 1971
4.914
-0.009
-0.19%
jan 1, 1972
4.638
-0.276
-5.62%
jan 1, 1973
3.572
-1.065
-22.97%
jan 1, 1974
3.577
+0.005
0.14%
jan 1, 1975
3.58
+0.002
0.06%
jan 1, 1976
3.576
-0.003
-0.09%
jan 1, 1977
3.569
-0.008
-0.22%
jan 1, 1978
3.55
-0.019
-0.53%
jan 1, 1979
3.511
-0.039
-1.1%
jan 1, 1980
3.449
-0.062
-1.76%
jan 1, 1981
3.373
-0.076
-2.2%
jan 1, 1982
3.292
-0.081
-2.41%
jan 1, 1983
3.219
-0.072
-2.2%
jan 1, 1984
3.129
-0.09
-2.8%
jan 1, 1985
3.028
-0.101
-3.23%
jan 1, 1986
2.922
-0.106
-3.49%
jan 1, 1987
2.808
-0.114
-3.9%
jan 1, 1988
2.706
-0.102
-3.63%
jan 1, 1989
2.642
-0.064
-2.37%
jan 1, 1990
2.626
-0.017
-0.63%
jan 1, 1991
2.636
+0.01
0.39%
jan 1, 1992
2.659
+0.023
0.86%
jan 1, 1993
2.661
+0.002
0.07%
jan 1, 1994
2.628
-0.033
-1.22%
jan 1, 1995
2.554
-0.074
-2.82%
jan 1, 1996
2.451
-0.103
-4.02%
jan 1, 1997
2.351
-0.1
-4.1%
jan 1, 1998
2.257
-0.094
-3.98%
jan 1, 1999
2.162
-0.095
-4.21%
jan 1, 2000
2.072
-0.091
-4.19%
jan 1, 2001
1.988
-0.084
-4.05%
jan 1, 2002
1.896
-0.091
-4.59%
jan 1, 2003
1.818
-0.079
-4.14%
jan 1, 2004
1.76
-0.058
-3.18%
jan 1, 2005
1.737
-0.023
-1.33%
jan 1, 2006
1.729
-0.007
-0.43%
jan 1, 2007
1.752
+0.022
1.3%
jan 1, 2008
1.765
+0.014
0.78%
jan 1, 2009
1.769
+0.004
0.23%
jan 1, 2010
1.76
-0.009
-0.51%
jan 1, 2011
1.739
-0.021
-1.19%
jan 1, 2012
1.717
-0.022
-1.27%
jan 1, 2013
1.7
-0.017
-1.0%
jan 1, 2014
1.687
-0.013
-0.79%
jan 1, 2015
1.678
-0.008
-0.48%
jan 1, 2016
1.672
-0.006
-0.37%
Ranking of countries by current statistics by years


Comments: