29
/
en
AIzaSyAYiBZKx7MnpbEhh9jyipgxe19OcubqV5w
April 1, 2024
65583
Albania
ALB
true
2
1
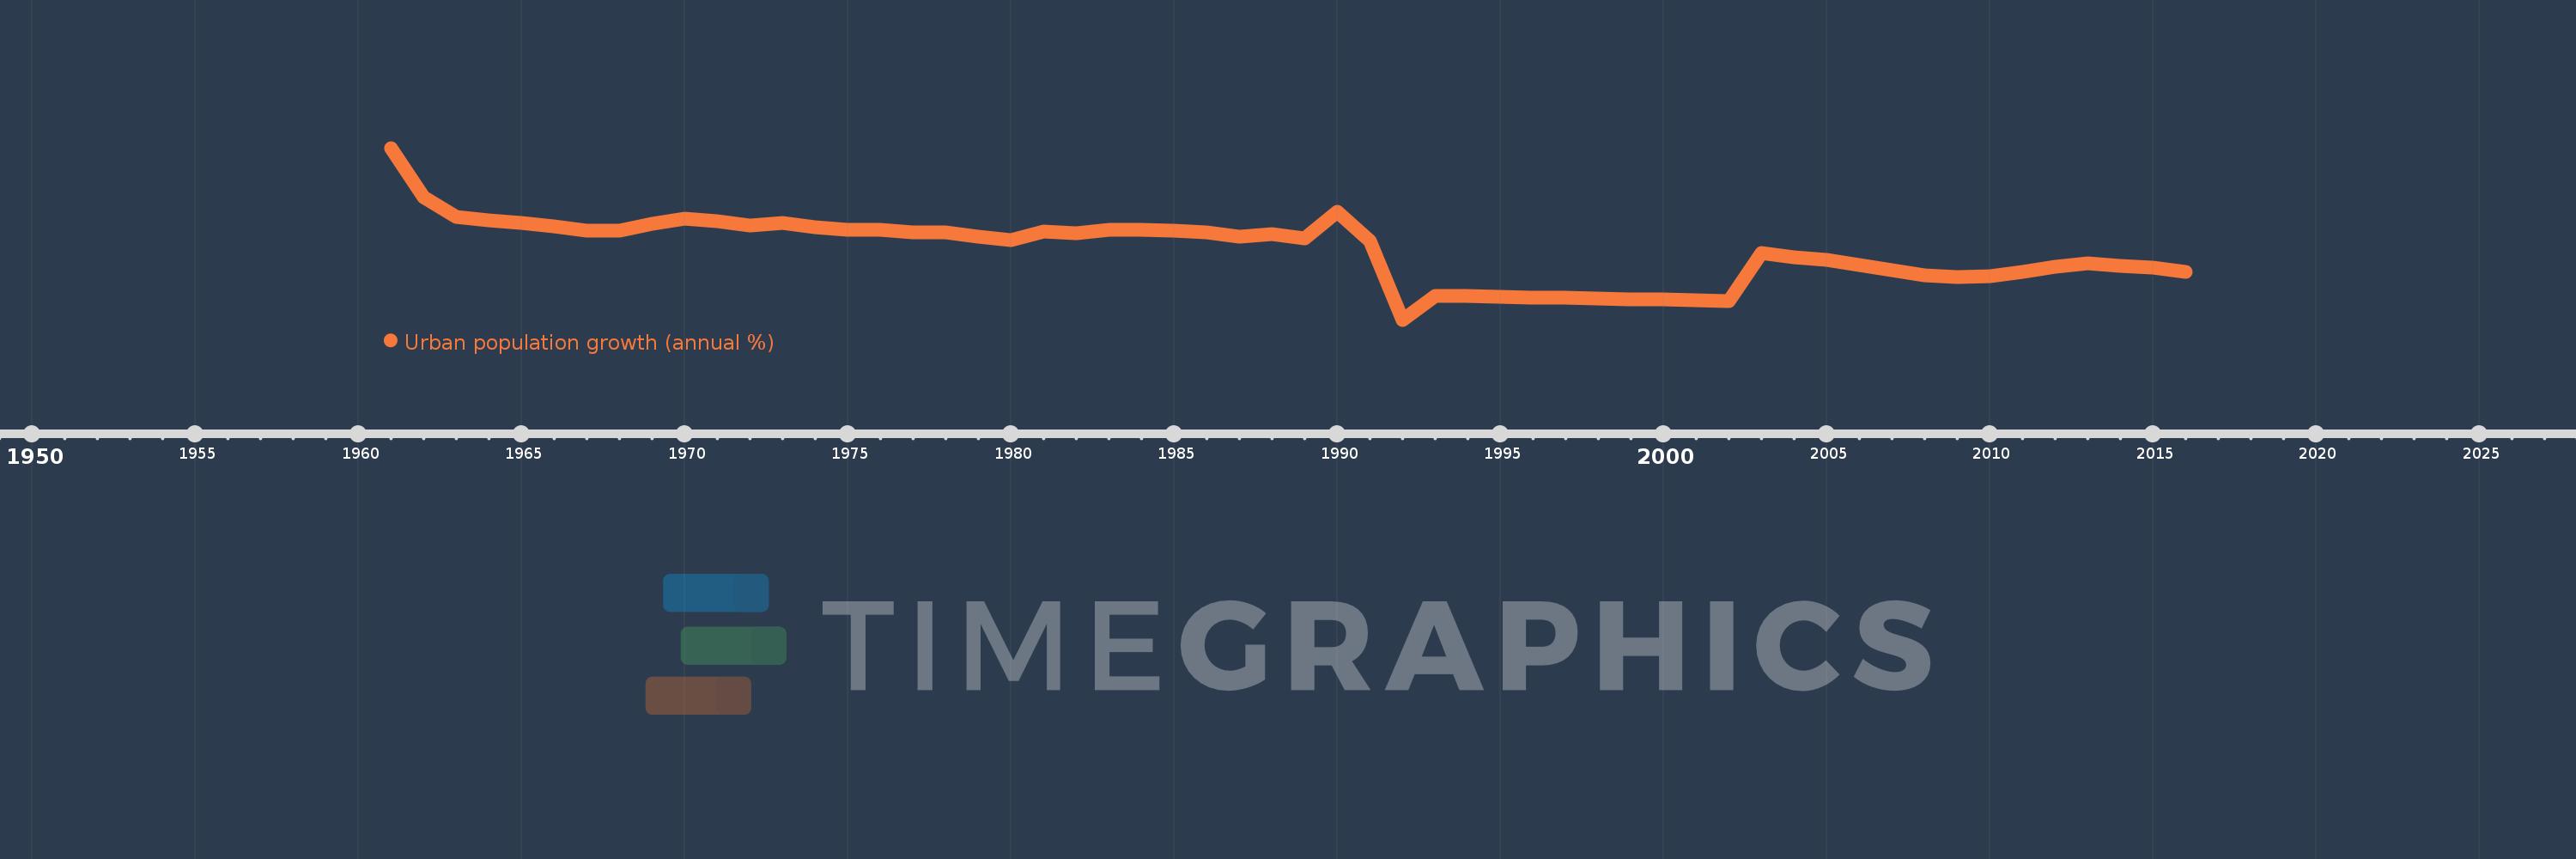
Urban population growth (annual %)
2016,2015,2014,2013,2012,2011,2010,2009,2008,2007,2006,2005,2004,2003,2002,2001,2000,1999,1998,1997,1996,1995,1994,1993,1992,1991,1990,1989,1988,1987,1986,1985,1984,1983,1982,1981,1980,1979,1978,1977,1976,1975,1974,1973,1972,1971,1970,1969,1968,1967,1966,1965,1964,1963,1962,1961
This statistics in other country:
AfghanistanAlbaniaAlgeriaAmerican SamoaAndorraAngolaAntigua and BarbudaArab WorldArgentinaArmeniaArubaAustraliaAustriaAzerbaijanBahamas, TheBahrainBangladeshBarbadosBelarusBelgiumBelizeBeninBermudaBhutanBoliviaBosnia and HerzegovinaBotswanaBrazilBritish Virgin IslandsBrunei DarussalamBulgariaBurkina FasoBurundiCabo VerdeCambodiaCameroonCanadaCaribbean small statesCayman IslandsCentral African RepublicCentral Europe and the BalticsChadChannel IslandsChileChinaColombiaComorosCongo, Dem. Rep.Congo, Rep.Costa RicaCote d'IvoireCroatiaCubaCuracaoCyprusCzech RepublicDenmarkDjiboutiDominicaDominican RepublicEarly-demographic dividendEast Asia & PacificEast Asia & Pacific (excluding high income)East Asia & Pacific (IDA & IBRD countries)EcuadorEgypt, Arab Rep.El SalvadorEquatorial GuineaEritreaEstoniaEthiopiaEuro areaEurope & Central AsiaEurope & Central Asia (excluding high income)Europe & Central Asia (IDA & IBRD countries)European UnionFaroe IslandsFijiFinlandFragile and conflict affected situationsFranceFrench PolynesiaGabonGambia, TheGeorgiaGermanyGhanaGibraltarGreeceGreenlandGrenadaGuamGuatemalaGuineaGuinea-BissauGuyanaHaitiHeavily indebted poor countries (HIPC)High incomeHondurasHong Kong SAR, ChinaHungaryIBRD onlyIcelandIDA & IBRD totalIDA blendIDA onlyIDA totalIndiaIndonesiaIran, Islamic Rep.IraqIrelandIsle of ManIsraelItalyJamaicaJapanJordanKazakhstanKenyaKiribatiKorea, Dem. People’s Rep.Korea, Rep.KuwaitKyrgyz RepublicLao PDRLate-demographic dividendLatin America & Caribbean Latin America & Caribbean (excluding high income)Latin America & the Caribbean (IDA & IBRD countries)LatviaLeast developed countries: UN classificationLebanonLesothoLiberiaLibyaLiechtensteinLithuaniaLow & middle incomeLow incomeLower middle incomeLuxembourgMacao SAR, ChinaMacedonia, FYRMadagascarMalawiMalaysiaMaldivesMaliMaltaMarshall IslandsMauritaniaMauritiusMexicoMicronesia, Fed. Sts.Middle East & North AfricaMiddle East & North Africa (excluding high income)Middle East & North Africa (IDA & IBRD countries)Middle incomeMoldovaMonacoMongoliaMontenegroMoroccoMozambiqueMyanmarNamibiaNauruNepalNetherlandsNew CaledoniaNew ZealandNicaraguaNigerNigeriaNorth AmericaNorthern Mariana IslandsNorwayOECD membersOmanOther small statesPacific island small statesPakistanPalauPanamaPapua New GuineaParaguayPeruPhilippinesPolandPortugalPost-demographic dividendPre-demographic dividendPuerto RicoQatarRomaniaRussian FederationRwandaSamoaSan MarinoSao Tome and PrincipeSaudi ArabiaSenegalSerbiaSeychellesSierra LeoneSingaporeSint Maarten (Dutch part)Slovak RepublicSloveniaSmall statesSolomon IslandsSomaliaSouth AfricaSouth AsiaSouth Asia (IDA & IBRD)South SudanSpainSri LankaSt. Kitts and NevisSt. LuciaSt. Vincent and the GrenadinesSub-Saharan Africa Sub-Saharan Africa (excluding high income)Sub-Saharan Africa (IDA & IBRD countries)SudanSurinameSwazilandSwedenSwitzerlandSyrian Arab RepublicTajikistanTanzaniaThailandTimor-LesteTogoTongaTrinidad and TobagoTunisiaTurkeyTurkmenistanTurks and Caicos IslandsTuvaluUgandaUkraineUnited Arab EmiratesUnited KingdomUnited StatesUpper middle incomeUruguayUzbekistanVanuatuVenezuela, RBVietnamVirgin Islands (U.S.)West Bank and GazaWorldYemen, Rep.ZambiaZimbabwe Timeline:
This timeline shows a graph from 1961 to 2016 of Albania. No data until 1960. Number of actual observations by date: 56.
Source name:
World Development Indicators
Source organization:
World Bank Staff estimates based on United Nations, World Urbanization Prospects.
Categories, topics:
Climate Change, Urban Development
Last updated:
apr 23, 2017
Indicators value changes by year
At the date of observation
Value
Absolute change
Change from previous value
jan 1, 1961
5.392
+5.392
0.0%
jan 1, 1962
3.893
-1.499
-27.79%
jan 1, 1963
3.289
-0.604
-15.51%
jan 1, 1964
3.182
-0.107
-3.25%
jan 1, 1965
3.112
-0.07
-2.21%
jan 1, 1966
2.985
-0.127
-4.09%
jan 1, 1967
2.865
-0.12
-4.02%
jan 1, 1968
2.86
-0.005
-0.18%
jan 1, 1969
3.072
+0.212
7.41%
jan 1, 1970
3.22
+0.148
4.82%
jan 1, 1971
3.158
-0.062
-1.93%
jan 1, 1972
3.029
-0.128
-4.07%
jan 1, 1973
3.101
+0.071
2.36%
jan 1, 1974
2.965
-0.136
-4.39%
jan 1, 1975
2.899
-0.066
-2.22%
jan 1, 1976
2.902
+0.003
0.12%
jan 1, 1977
2.806
-0.096
-3.32%
jan 1, 1978
2.81
+0.004
0.15%
jan 1, 1979
2.669
-0.141
-5.01%
jan 1, 1980
2.582
-0.087
-3.25%
jan 1, 1981
2.827
+0.245
9.48%
jan 1, 1982
2.776
-0.051
-1.81%
jan 1, 1983
2.883
+0.107
3.87%
jan 1, 1984
2.891
+0.008
0.26%
jan 1, 1985
2.868
-0.023
-0.79%
jan 1, 1986
2.817
-0.051
-1.78%
jan 1, 1987
2.691
-0.126
-4.46%
jan 1, 1988
2.755
+0.064
2.37%
jan 1, 1989
2.639
-0.116
-4.21%
jan 1, 1990
3.437
+0.798
30.25%
jan 1, 1991
2.543
-0.894
-26.02%
jan 1, 1992
0.141
-2.402
-94.45%
jan 1, 1993
0.878
+0.737
522.73%
jan 1, 1994
0.856
-0.023
-2.61%
jan 1, 1995
0.844
-0.012
-1.38%
jan 1, 1996
0.824
-0.02
-2.32%
jan 1, 1997
0.812
-0.012
-1.42%
jan 1, 1998
0.788
-0.024
-2.98%
jan 1, 1999
0.775
-0.014
-1.74%
jan 1, 2000
0.756
-0.019
-2.39%
jan 1, 2001
0.742
-0.014
-1.79%
jan 1, 2002
0.71
-0.032
-4.31%
jan 1, 2003
2.181
+1.471
207.02%
jan 1, 2004
2.06
-0.121
-5.54%
jan 1, 2005
1.972
-0.088
-4.29%
jan 1, 2006
1.826
-0.145
-7.37%
jan 1, 2007
1.662
-0.164
-8.99%
jan 1, 2008
1.492
-0.17
-10.23%
jan 1, 2009
1.435
-0.057
-3.83%
jan 1, 2010
1.473
+0.038
2.66%
jan 1, 2011
1.609
+0.136
9.24%
jan 1, 2012
1.773
+0.164
10.2%
jan 1, 2013
1.857
+0.084
4.73%
jan 1, 2014
1.796
-0.062
-3.32%
jan 1, 2015
1.732
-0.064
-3.54%
jan 1, 2016
1.599
-0.133
-7.7%
Ranking of countries by current statistics by years


Comments: