29
/
en
AIzaSyAYiBZKx7MnpbEhh9jyipgxe19OcubqV5w
April 1, 2024
273102
Uganda
UGA
true
2
1
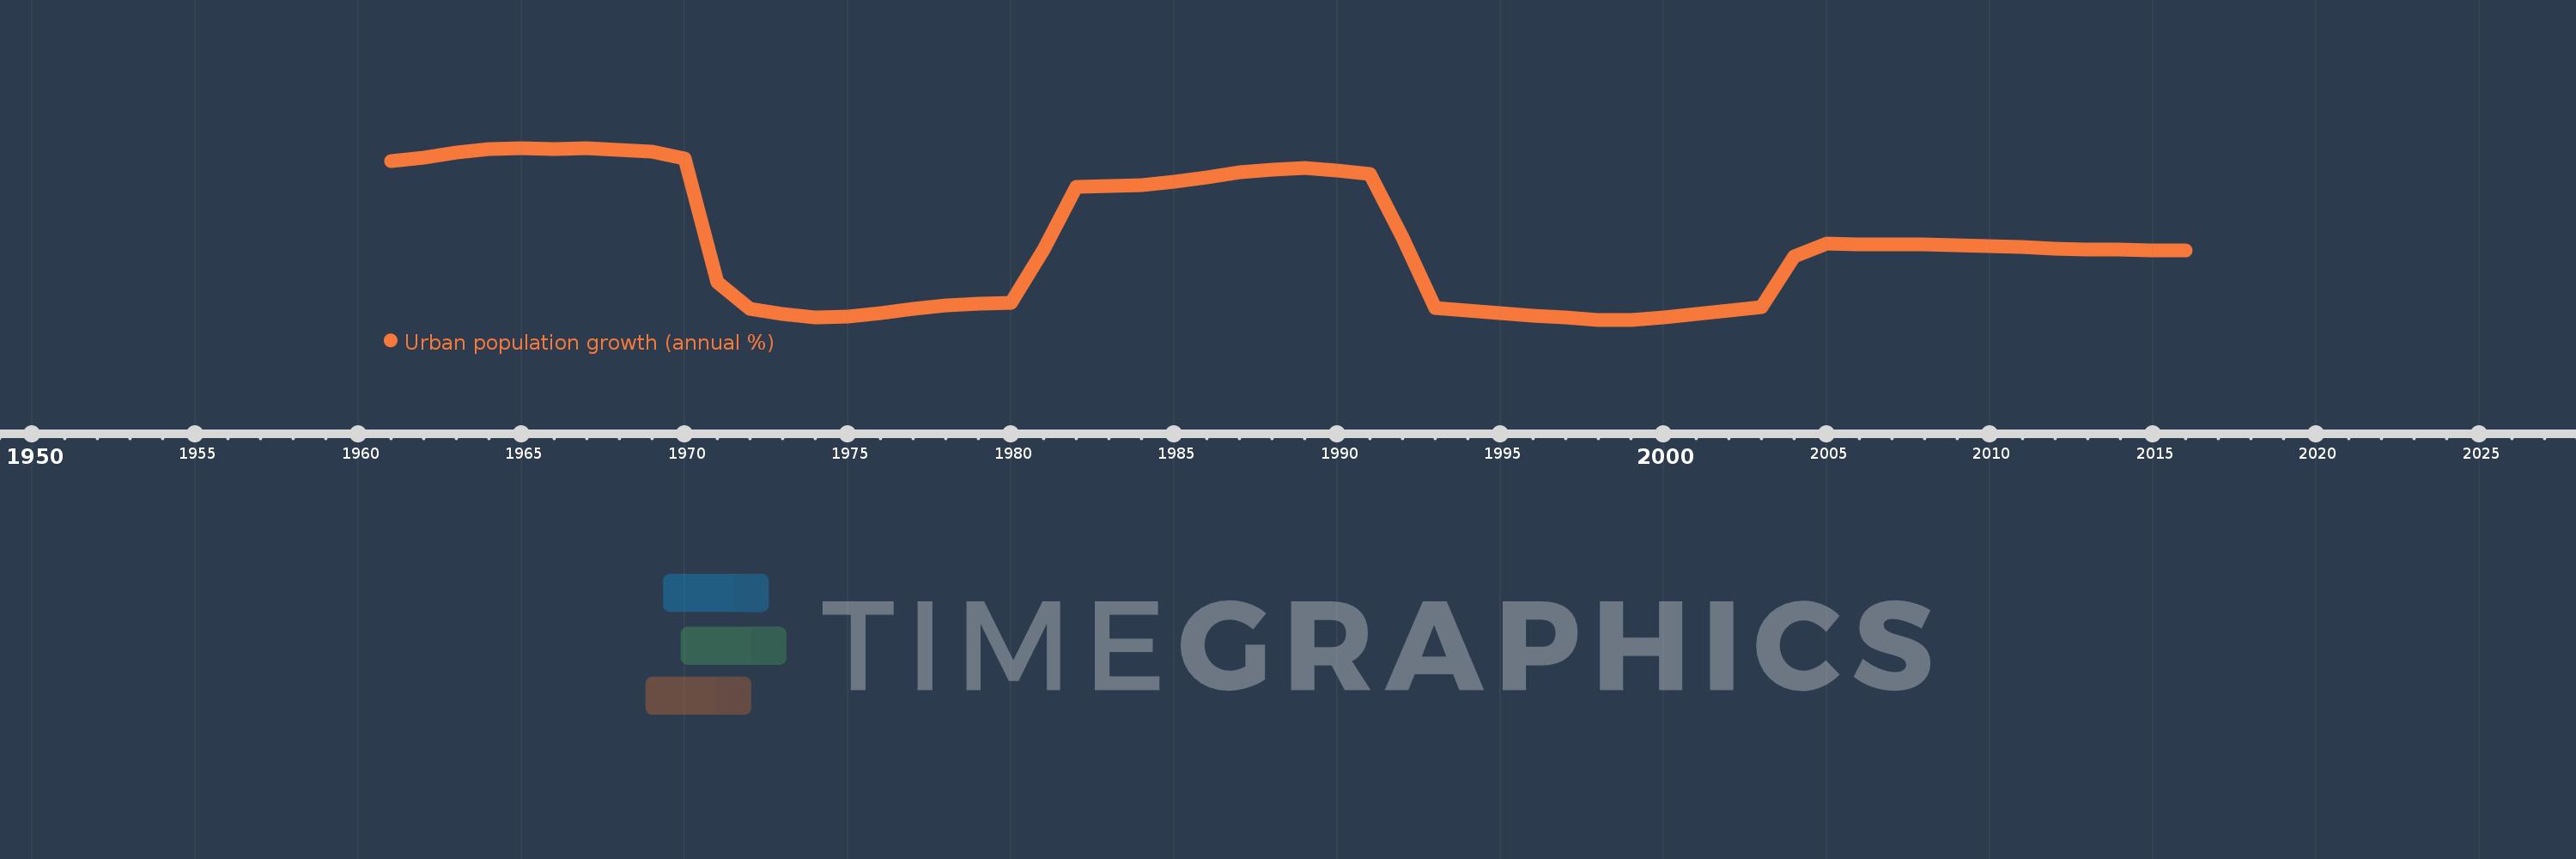
Urban population growth (annual %)
2016,2015,2014,2013,2012,2011,2010,2009,2008,2007,2006,2005,2004,2003,2002,2001,2000,1999,1998,1997,1996,1995,1994,1993,1992,1991,1990,1989,1988,1987,1986,1985,1984,1983,1982,1981,1980,1979,1978,1977,1976,1975,1974,1973,1972,1971,1970,1969,1968,1967,1966,1965,1964,1963,1962,1961
This statistics in other country:
AfghanistanAlbaniaAlgeriaAmerican SamoaAndorraAngolaAntigua and BarbudaArab WorldArgentinaArmeniaArubaAustraliaAustriaAzerbaijanBahamas, TheBahrainBangladeshBarbadosBelarusBelgiumBelizeBeninBermudaBhutanBoliviaBosnia and HerzegovinaBotswanaBrazilBritish Virgin IslandsBrunei DarussalamBulgariaBurkina FasoBurundiCabo VerdeCambodiaCameroonCanadaCaribbean small statesCayman IslandsCentral African RepublicCentral Europe and the BalticsChadChannel IslandsChileChinaColombiaComorosCongo, Dem. Rep.Congo, Rep.Costa RicaCote d'IvoireCroatiaCubaCuracaoCyprusCzech RepublicDenmarkDjiboutiDominicaDominican RepublicEarly-demographic dividendEast Asia & PacificEast Asia & Pacific (excluding high income)East Asia & Pacific (IDA & IBRD countries)EcuadorEgypt, Arab Rep.El SalvadorEquatorial GuineaEritreaEstoniaEthiopiaEuro areaEurope & Central AsiaEurope & Central Asia (excluding high income)Europe & Central Asia (IDA & IBRD countries)European UnionFaroe IslandsFijiFinlandFragile and conflict affected situationsFranceFrench PolynesiaGabonGambia, TheGeorgiaGermanyGhanaGibraltarGreeceGreenlandGrenadaGuamGuatemalaGuineaGuinea-BissauGuyanaHaitiHeavily indebted poor countries (HIPC)High incomeHondurasHong Kong SAR, ChinaHungaryIBRD onlyIcelandIDA & IBRD totalIDA blendIDA onlyIDA totalIndiaIndonesiaIran, Islamic Rep.IraqIrelandIsle of ManIsraelItalyJamaicaJapanJordanKazakhstanKenyaKiribatiKorea, Dem. People’s Rep.Korea, Rep.KuwaitKyrgyz RepublicLao PDRLate-demographic dividendLatin America & Caribbean Latin America & Caribbean (excluding high income)Latin America & the Caribbean (IDA & IBRD countries)LatviaLeast developed countries: UN classificationLebanonLesothoLiberiaLibyaLiechtensteinLithuaniaLow & middle incomeLow incomeLower middle incomeLuxembourgMacao SAR, ChinaMacedonia, FYRMadagascarMalawiMalaysiaMaldivesMaliMaltaMarshall IslandsMauritaniaMauritiusMexicoMicronesia, Fed. Sts.Middle East & North AfricaMiddle East & North Africa (excluding high income)Middle East & North Africa (IDA & IBRD countries)Middle incomeMoldovaMonacoMongoliaMontenegroMoroccoMozambiqueMyanmarNamibiaNauruNepalNetherlandsNew CaledoniaNew ZealandNicaraguaNigerNigeriaNorth AmericaNorthern Mariana IslandsNorwayOECD membersOmanOther small statesPacific island small statesPakistanPalauPanamaPapua New GuineaParaguayPeruPhilippinesPolandPortugalPost-demographic dividendPre-demographic dividendPuerto RicoQatarRomaniaRussian FederationRwandaSamoaSan MarinoSao Tome and PrincipeSaudi ArabiaSenegalSerbiaSeychellesSierra LeoneSingaporeSint Maarten (Dutch part)Slovak RepublicSloveniaSmall statesSolomon IslandsSomaliaSouth AfricaSouth AsiaSouth Asia (IDA & IBRD)South SudanSpainSri LankaSt. Kitts and NevisSt. LuciaSt. Vincent and the GrenadinesSub-Saharan Africa Sub-Saharan Africa (excluding high income)Sub-Saharan Africa (IDA & IBRD countries)SudanSurinameSwazilandSwedenSwitzerlandSyrian Arab RepublicTajikistanTanzaniaThailandTimor-LesteTogoTongaTrinidad and TobagoTunisiaTurkeyTurkmenistanTurks and Caicos IslandsTuvaluUgandaUkraineUnited Arab EmiratesUnited KingdomUnited StatesUpper middle incomeUruguayUzbekistanVanuatuVenezuela, RBVietnamVirgin Islands (U.S.)West Bank and GazaWorldYemen, Rep.ZambiaZimbabwe Timeline:
This timeline shows a graph from 1961 to 2016 of Uganda. No data until 1960. Number of actual observations by date: 56.
Source name:
World Development Indicators
Source organization:
World Bank Staff estimates based on United Nations, World Urbanization Prospects.
Categories, topics:
Climate Change, Urban Development
Last updated:
apr 23, 2017
Indicators value changes by year
At the date of observation
Value
Absolute change
Change from previous value
jan 1, 1961
7.505
+7.505
0.0%
jan 1, 1962
7.595
+0.09
1.2%
jan 1, 1963
7.706
+0.11
1.45%
jan 1, 1964
7.796
+0.09
1.17%
jan 1, 1965
7.818
+0.022
0.28%
jan 1, 1966
7.782
-0.036
-0.46%
jan 1, 1967
7.818
+0.036
0.46%
jan 1, 1968
7.78
-0.038
-0.48%
jan 1, 1969
7.725
-0.055
-0.71%
jan 1, 1970
7.56
-0.165
-2.13%
jan 1, 1971
4.587
-2.973
-39.32%
jan 1, 1972
3.952
-0.635
-13.83%
jan 1, 1973
3.826
-0.126
-3.19%
jan 1, 1974
3.743
-0.083
-2.18%
jan 1, 1975
3.765
+0.022
0.59%
jan 1, 1976
3.848
+0.082
2.19%
jan 1, 1977
3.949
+0.102
2.64%
jan 1, 1978
4.031
+0.082
2.09%
jan 1, 1979
4.074
+0.042
1.05%
jan 1, 1980
4.092
+0.018
0.45%
jan 1, 1981
5.385
+1.293
31.59%
jan 1, 1982
6.882
+1.498
27.81%
jan 1, 1983
6.899
+0.016
0.23%
jan 1, 1984
6.915
+0.016
0.24%
jan 1, 1985
7.004
+0.089
1.29%
jan 1, 1986
7.115
+0.111
1.59%
jan 1, 1987
7.225
+0.11
1.55%
jan 1, 1988
7.298
+0.072
1.0%
jan 1, 1989
7.331
+0.033
0.45%
jan 1, 1990
7.282
-0.049
-0.66%
jan 1, 1991
7.187
-0.095
-1.3%
jan 1, 1992
5.67
-1.517
-21.11%
jan 1, 1993
3.977
-1.694
-29.87%
jan 1, 1994
3.919
-0.058
-1.46%
jan 1, 1995
3.86
-0.058
-1.49%
jan 1, 1996
3.798
-0.062
-1.6%
jan 1, 1997
3.742
-0.057
-1.5%
jan 1, 1998
3.691
-0.05
-1.34%
jan 1, 1999
3.694
+0.003
0.09%
jan 1, 2000
3.743
+0.049
1.31%
jan 1, 2001
3.832
+0.089
2.39%
jan 1, 2002
3.919
+0.087
2.27%
jan 1, 2003
3.996
+0.077
1.96%
jan 1, 2004
5.203
+1.206
30.19%
jan 1, 2005
5.52
+0.317
6.09%
jan 1, 2006
5.505
-0.015
-0.27%
jan 1, 2007
5.502
-0.003
-0.05%
jan 1, 2008
5.493
-0.009
-0.16%
jan 1, 2009
5.477
-0.016
-0.3%
jan 1, 2010
5.453
-0.023
-0.43%
jan 1, 2011
5.432
-0.021
-0.38%
jan 1, 2012
5.399
-0.033
-0.61%
jan 1, 2013
5.38
-0.019
-0.36%
jan 1, 2014
5.367
-0.013
-0.24%
jan 1, 2015
5.363
-0.005
-0.08%
jan 1, 2016
5.356
-0.007
-0.13%
Ranking of countries by current statistics by years


Comments: