29
/
en
AIzaSyAYiBZKx7MnpbEhh9jyipgxe19OcubqV5w
April 1, 2024
276298
United Kingdom
GBR
true
2
1
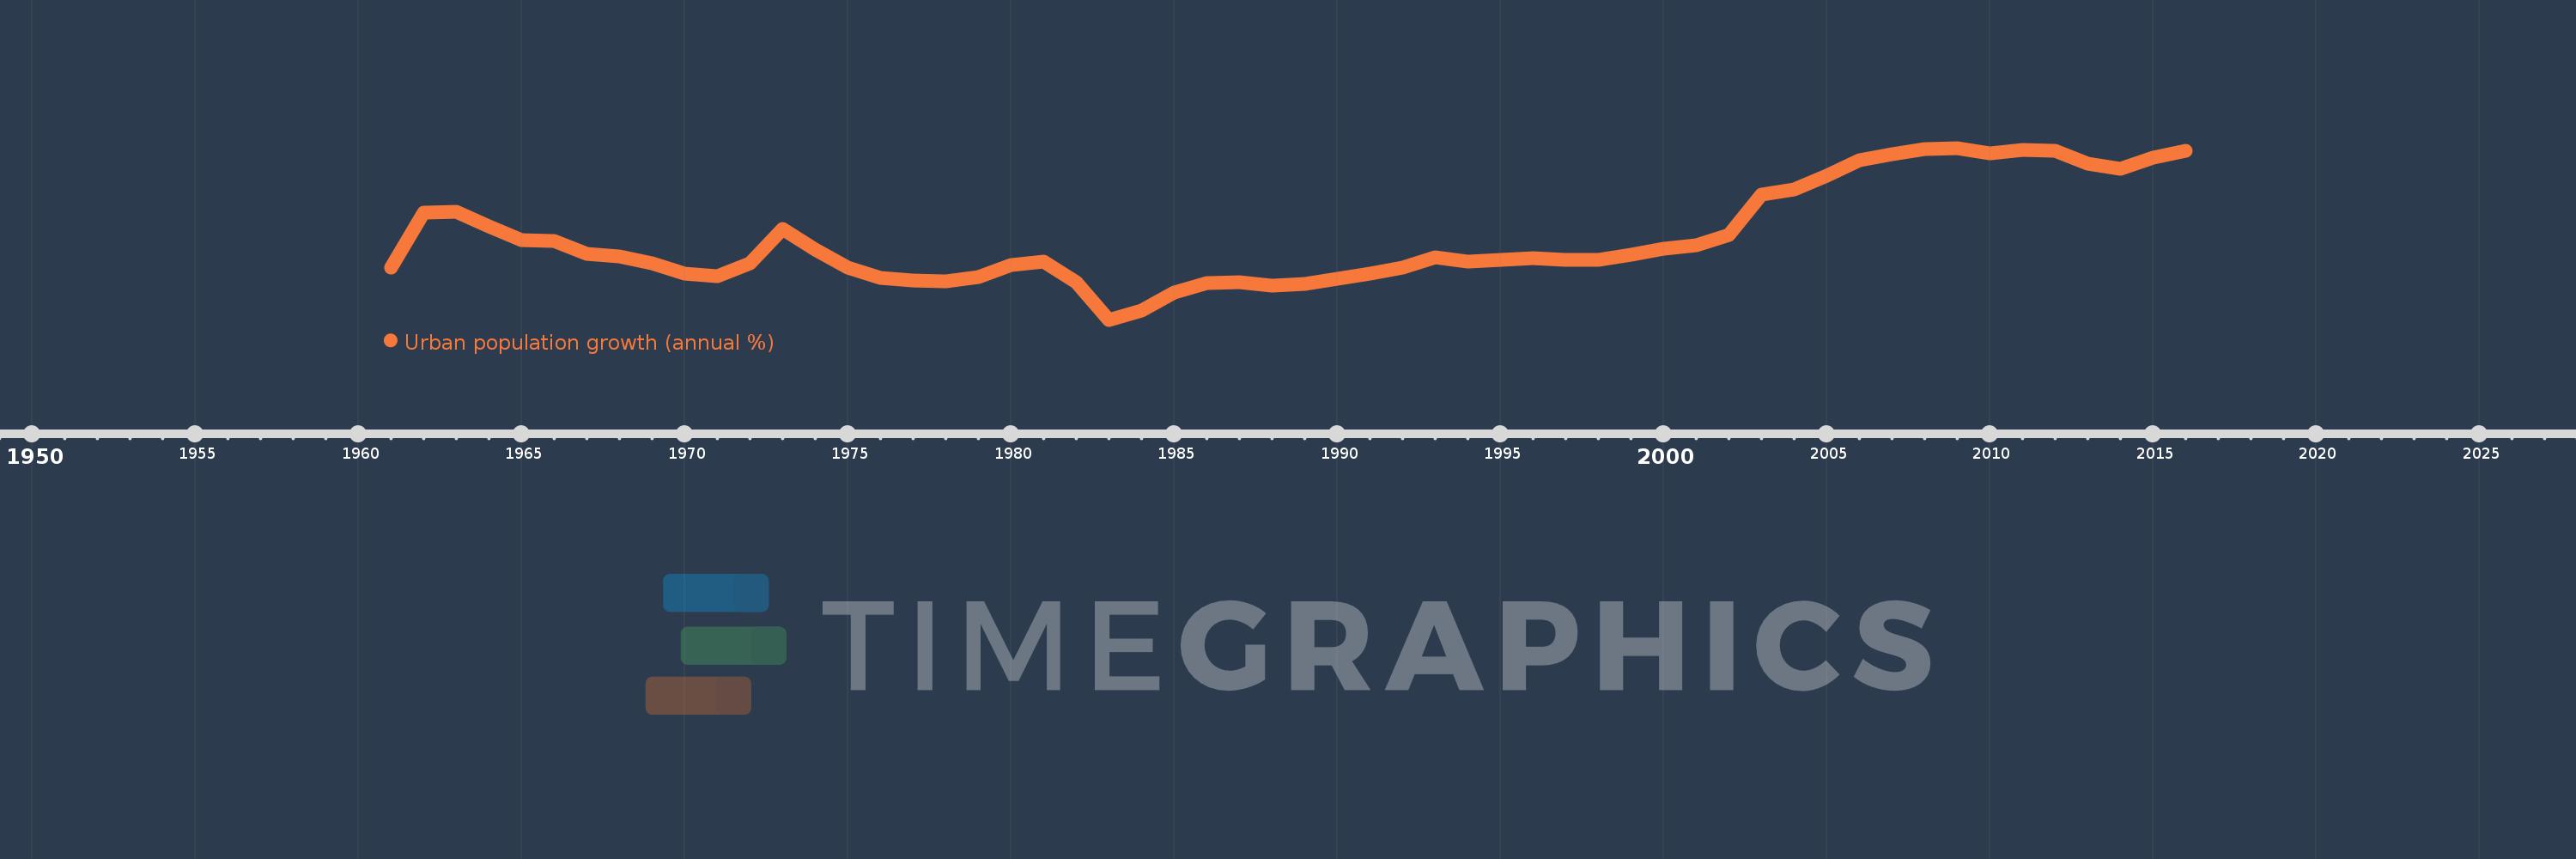
Urban population growth (annual %)
2016,2015,2014,2013,2012,2011,2010,2009,2008,2007,2006,2005,2004,2003,2002,2001,2000,1999,1998,1997,1996,1995,1994,1993,1992,1991,1990,1989,1988,1987,1986,1985,1984,1983,1982,1981,1980,1979,1978,1977,1976,1975,1974,1973,1972,1971,1970,1969,1968,1967,1966,1965,1964,1963,1962,1961
This statistics in other country:
AfghanistanAlbaniaAlgeriaAmerican SamoaAndorraAngolaAntigua and BarbudaArab WorldArgentinaArmeniaArubaAustraliaAustriaAzerbaijanBahamas, TheBahrainBangladeshBarbadosBelarusBelgiumBelizeBeninBermudaBhutanBoliviaBosnia and HerzegovinaBotswanaBrazilBritish Virgin IslandsBrunei DarussalamBulgariaBurkina FasoBurundiCabo VerdeCambodiaCameroonCanadaCaribbean small statesCayman IslandsCentral African RepublicCentral Europe and the BalticsChadChannel IslandsChileChinaColombiaComorosCongo, Dem. Rep.Congo, Rep.Costa RicaCote d'IvoireCroatiaCubaCuracaoCyprusCzech RepublicDenmarkDjiboutiDominicaDominican RepublicEarly-demographic dividendEast Asia & PacificEast Asia & Pacific (excluding high income)East Asia & Pacific (IDA & IBRD countries)EcuadorEgypt, Arab Rep.El SalvadorEquatorial GuineaEritreaEstoniaEthiopiaEuro areaEurope & Central AsiaEurope & Central Asia (excluding high income)Europe & Central Asia (IDA & IBRD countries)European UnionFaroe IslandsFijiFinlandFragile and conflict affected situationsFranceFrench PolynesiaGabonGambia, TheGeorgiaGermanyGhanaGibraltarGreeceGreenlandGrenadaGuamGuatemalaGuineaGuinea-BissauGuyanaHaitiHeavily indebted poor countries (HIPC)High incomeHondurasHong Kong SAR, ChinaHungaryIBRD onlyIcelandIDA & IBRD totalIDA blendIDA onlyIDA totalIndiaIndonesiaIran, Islamic Rep.IraqIrelandIsle of ManIsraelItalyJamaicaJapanJordanKazakhstanKenyaKiribatiKorea, Dem. People’s Rep.Korea, Rep.KuwaitKyrgyz RepublicLao PDRLate-demographic dividendLatin America & Caribbean Latin America & Caribbean (excluding high income)Latin America & the Caribbean (IDA & IBRD countries)LatviaLeast developed countries: UN classificationLebanonLesothoLiberiaLibyaLiechtensteinLithuaniaLow & middle incomeLow incomeLower middle incomeLuxembourgMacao SAR, ChinaMacedonia, FYRMadagascarMalawiMalaysiaMaldivesMaliMaltaMarshall IslandsMauritaniaMauritiusMexicoMicronesia, Fed. Sts.Middle East & North AfricaMiddle East & North Africa (excluding high income)Middle East & North Africa (IDA & IBRD countries)Middle incomeMoldovaMonacoMongoliaMontenegroMoroccoMozambiqueMyanmarNamibiaNauruNepalNetherlandsNew CaledoniaNew ZealandNicaraguaNigerNigeriaNorth AmericaNorthern Mariana IslandsNorwayOECD membersOmanOther small statesPacific island small statesPakistanPalauPanamaPapua New GuineaParaguayPeruPhilippinesPolandPortugalPost-demographic dividendPre-demographic dividendPuerto RicoQatarRomaniaRussian FederationRwandaSamoaSan MarinoSao Tome and PrincipeSaudi ArabiaSenegalSerbiaSeychellesSierra LeoneSingaporeSint Maarten (Dutch part)Slovak RepublicSloveniaSmall statesSolomon IslandsSomaliaSouth AfricaSouth AsiaSouth Asia (IDA & IBRD)South SudanSpainSri LankaSt. Kitts and NevisSt. LuciaSt. Vincent and the GrenadinesSub-Saharan Africa Sub-Saharan Africa (excluding high income)Sub-Saharan Africa (IDA & IBRD countries)SudanSurinameSwazilandSwedenSwitzerlandSyrian Arab RepublicTajikistanTanzaniaThailandTimor-LesteTogoTongaTrinidad and TobagoTunisiaTurkeyTurkmenistanTurks and Caicos IslandsTuvaluUgandaUkraineUnited Arab EmiratesUnited KingdomUnited StatesUpper middle incomeUruguayUzbekistanVanuatuVenezuela, RBVietnamVirgin Islands (U.S.)West Bank and GazaWorldYemen, Rep.ZambiaZimbabwe Timeline:
This timeline shows a graph from 1961 to 2016 of United Kingdom. No data until 1960. Number of actual observations by date: 56.
Source name:
World Development Indicators
Source organization:
World Bank Staff estimates based on United Nations, World Urbanization Prospects.
Categories, topics:
Climate Change, Urban Development
Last updated:
apr 23, 2017
Indicators value changes by year
Minimum:
-0.098
jan 1, 1983
At the date of observation
Value
Absolute change
Change from previous value
jan 1, 1961
0.277
+0.277
0.0%
jan 1, 1962
0.671
+0.394
142.03%
jan 1, 1963
0.674
+0.003
0.38%
jan 1, 1964
0.572
-0.102
-15.12%
jan 1, 1965
0.472
-0.1
-17.44%
jan 1, 1966
0.464
-0.008
-1.72%
jan 1, 1967
0.373
-0.091
-19.72%
jan 1, 1968
0.357
-0.016
-4.2%
jan 1, 1969
0.305
-0.052
-14.6%
jan 1, 1970
0.233
-0.071
-23.39%
jan 1, 1971
0.215
-0.019
-8.01%
jan 1, 1972
0.305
+0.09
41.92%
jan 1, 1973
0.553
+0.248
81.45%
jan 1, 1974
0.404
-0.149
-26.92%
jan 1, 1975
0.274
-0.131
-32.31%
jan 1, 1976
0.201
-0.072
-26.4%
jan 1, 1977
0.182
-0.019
-9.39%
jan 1, 1978
0.174
-0.009
-4.77%
jan 1, 1979
0.209
+0.035
20.29%
jan 1, 1980
0.293
+0.084
40.17%
jan 1, 1981
0.321
+0.028
9.59%
jan 1, 1982
0.171
-0.15
-46.72%
jan 1, 1983
-0.098
-0.269
-157.41%
jan 1, 1984
-0.03
+0.069
-69.88%
jan 1, 1985
0.096
+0.125
-423.88%
jan 1, 1986
0.163
+0.067
70.32%
jan 1, 1987
0.168
+0.005
2.83%
jan 1, 1988
0.149
-0.019
-11.33%
jan 1, 1989
0.158
+0.009
6.31%
jan 1, 1990
0.196
+0.038
24.15%
jan 1, 1991
0.235
+0.039
19.65%
jan 1, 1992
0.273
+0.038
16.36%
jan 1, 1993
0.347
+0.074
26.99%
jan 1, 1994
0.316
-0.031
-8.85%
jan 1, 1995
0.333
+0.016
5.08%
jan 1, 1996
0.341
+0.009
2.59%
jan 1, 1997
0.331
-0.01
-2.93%
jan 1, 1998
0.333
+0.002
0.48%
jan 1, 1999
0.368
+0.035
10.54%
jan 1, 2000
0.409
+0.041
11.06%
jan 1, 2001
0.434
+0.025
6.15%
jan 1, 2002
0.512
+0.078
18.09%
jan 1, 2003
0.799
+0.286
55.94%
jan 1, 2004
0.834
+0.036
4.49%
jan 1, 2005
0.934
+0.099
11.92%
jan 1, 2006
1.045
+0.111
11.92%
jan 1, 2007
1.09
+0.045
4.27%
jan 1, 2008
1.127
+0.037
3.43%
jan 1, 2009
1.132
+0.005
0.42%
jan 1, 2010
1.095
-0.037
-3.25%
jan 1, 2011
1.118
+0.023
2.07%
jan 1, 2012
1.111
-0.007
-0.63%
jan 1, 2013
1.018
-0.092
-8.31%
jan 1, 2014
0.984
-0.034
-3.35%
jan 1, 2015
1.061
+0.077
7.8%
jan 1, 2016
1.109
+0.048
4.5%
Ranking of countries by current statistics by years


Comments: