29
/
en
AIzaSyAYiBZKx7MnpbEhh9jyipgxe19OcubqV5w
April 1, 2024
110489
Congo, Dem. Rep.
COD
true
2
1
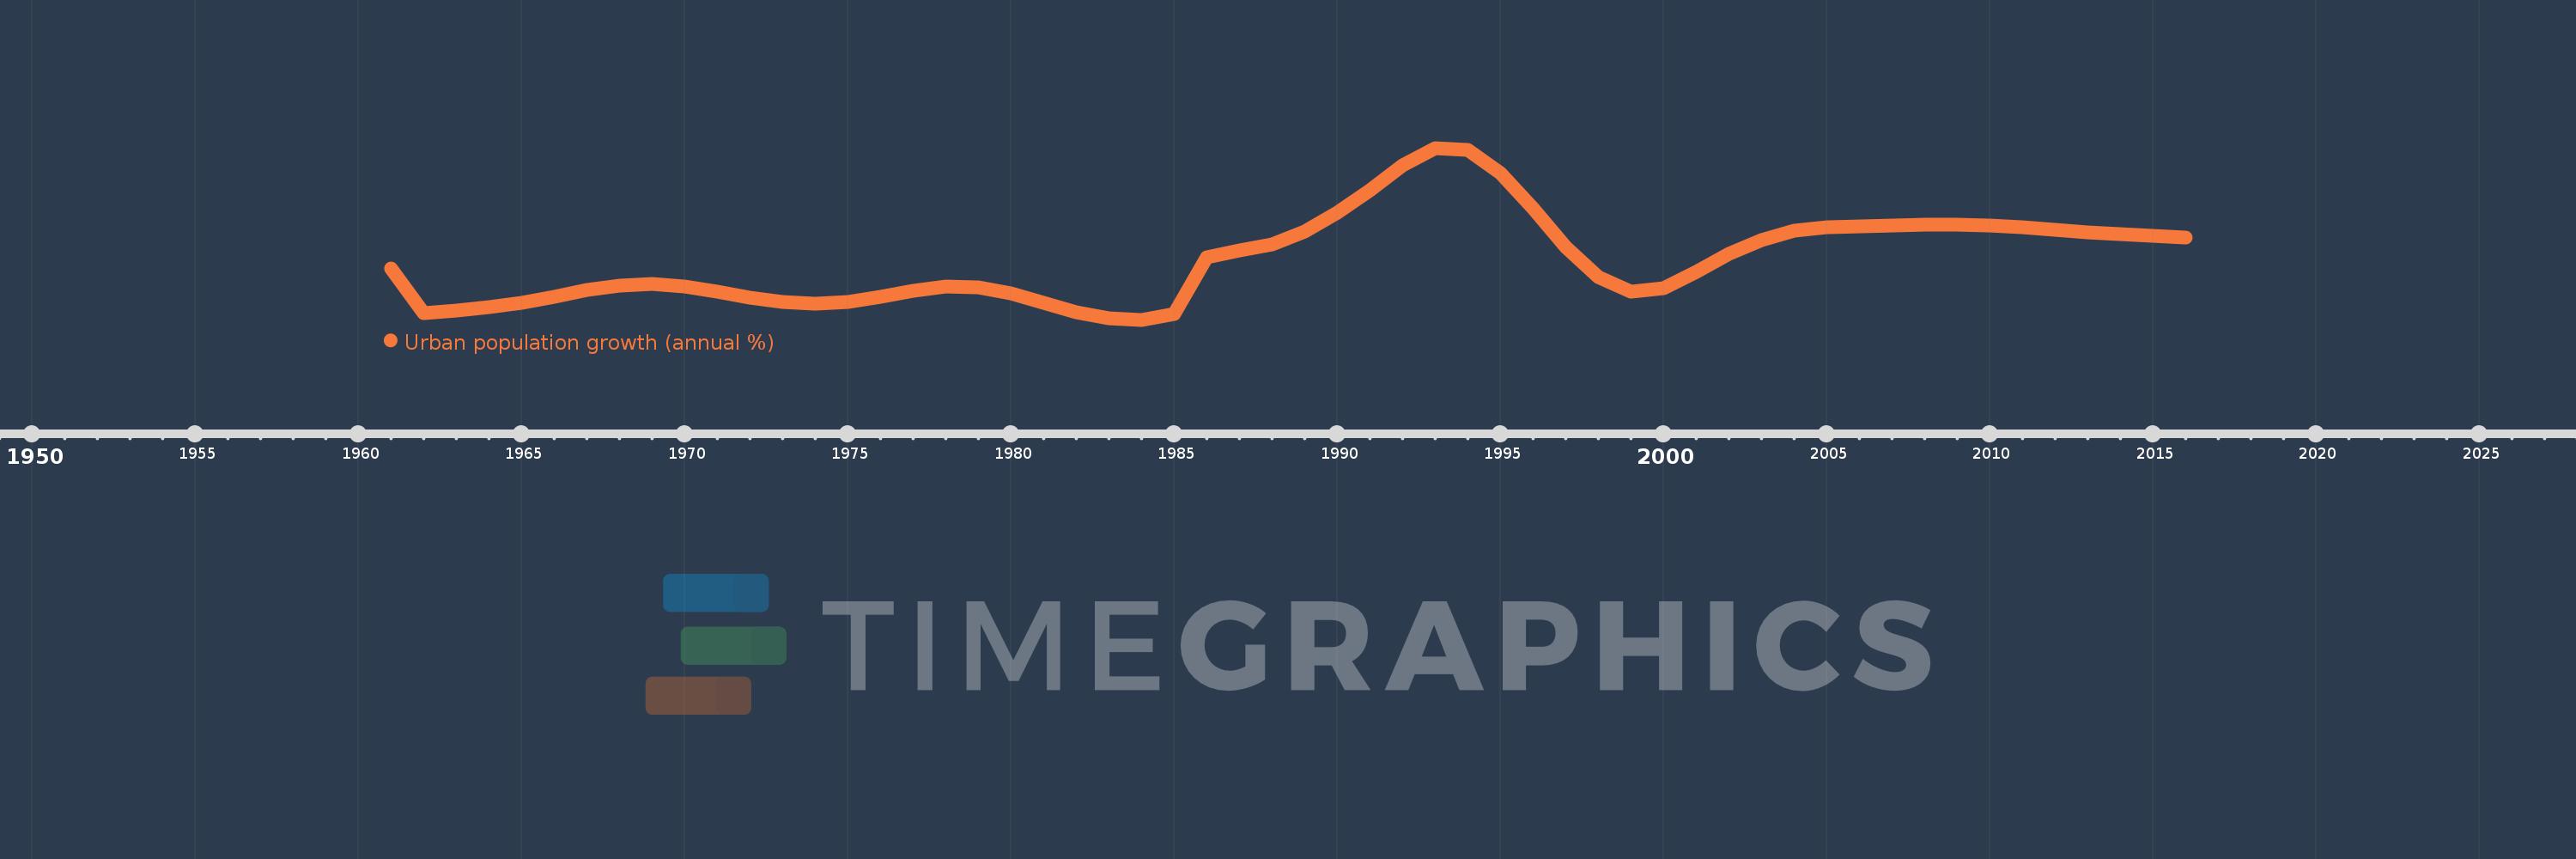
Urban population growth (annual %)
2016,2015,2014,2013,2012,2011,2010,2009,2008,2007,2006,2005,2004,2003,2002,2001,2000,1999,1998,1997,1996,1995,1994,1993,1992,1991,1990,1989,1988,1987,1986,1985,1984,1983,1982,1981,1980,1979,1978,1977,1976,1975,1974,1973,1972,1971,1970,1969,1968,1967,1966,1965,1964,1963,1962,1961
This statistics in other country:
AfghanistanAlbaniaAlgeriaAmerican SamoaAndorraAngolaAntigua and BarbudaArab WorldArgentinaArmeniaArubaAustraliaAustriaAzerbaijanBahamas, TheBahrainBangladeshBarbadosBelarusBelgiumBelizeBeninBermudaBhutanBoliviaBosnia and HerzegovinaBotswanaBrazilBritish Virgin IslandsBrunei DarussalamBulgariaBurkina FasoBurundiCabo VerdeCambodiaCameroonCanadaCaribbean small statesCayman IslandsCentral African RepublicCentral Europe and the BalticsChadChannel IslandsChileChinaColombiaComorosCongo, Dem. Rep.Congo, Rep.Costa RicaCote d'IvoireCroatiaCubaCuracaoCyprusCzech RepublicDenmarkDjiboutiDominicaDominican RepublicEarly-demographic dividendEast Asia & PacificEast Asia & Pacific (excluding high income)East Asia & Pacific (IDA & IBRD countries)EcuadorEgypt, Arab Rep.El SalvadorEquatorial GuineaEritreaEstoniaEthiopiaEuro areaEurope & Central AsiaEurope & Central Asia (excluding high income)Europe & Central Asia (IDA & IBRD countries)European UnionFaroe IslandsFijiFinlandFragile and conflict affected situationsFranceFrench PolynesiaGabonGambia, TheGeorgiaGermanyGhanaGibraltarGreeceGreenlandGrenadaGuamGuatemalaGuineaGuinea-BissauGuyanaHaitiHeavily indebted poor countries (HIPC)High incomeHondurasHong Kong SAR, ChinaHungaryIBRD onlyIcelandIDA & IBRD totalIDA blendIDA onlyIDA totalIndiaIndonesiaIran, Islamic Rep.IraqIrelandIsle of ManIsraelItalyJamaicaJapanJordanKazakhstanKenyaKiribatiKorea, Dem. People’s Rep.Korea, Rep.KuwaitKyrgyz RepublicLao PDRLate-demographic dividendLatin America & Caribbean Latin America & Caribbean (excluding high income)Latin America & the Caribbean (IDA & IBRD countries)LatviaLeast developed countries: UN classificationLebanonLesothoLiberiaLibyaLiechtensteinLithuaniaLow & middle incomeLow incomeLower middle incomeLuxembourgMacao SAR, ChinaMacedonia, FYRMadagascarMalawiMalaysiaMaldivesMaliMaltaMarshall IslandsMauritaniaMauritiusMexicoMicronesia, Fed. Sts.Middle East & North AfricaMiddle East & North Africa (excluding high income)Middle East & North Africa (IDA & IBRD countries)Middle incomeMoldovaMonacoMongoliaMontenegroMoroccoMozambiqueMyanmarNamibiaNauruNepalNetherlandsNew CaledoniaNew ZealandNicaraguaNigerNigeriaNorth AmericaNorthern Mariana IslandsNorwayOECD membersOmanOther small statesPacific island small statesPakistanPalauPanamaPapua New GuineaParaguayPeruPhilippinesPolandPortugalPost-demographic dividendPre-demographic dividendPuerto RicoQatarRomaniaRussian FederationRwandaSamoaSan MarinoSao Tome and PrincipeSaudi ArabiaSenegalSerbiaSeychellesSierra LeoneSingaporeSint Maarten (Dutch part)Slovak RepublicSloveniaSmall statesSolomon IslandsSomaliaSouth AfricaSouth AsiaSouth Asia (IDA & IBRD)South SudanSpainSri LankaSt. Kitts and NevisSt. LuciaSt. Vincent and the GrenadinesSub-Saharan Africa Sub-Saharan Africa (excluding high income)Sub-Saharan Africa (IDA & IBRD countries)SudanSurinameSwazilandSwedenSwitzerlandSyrian Arab RepublicTajikistanTanzaniaThailandTimor-LesteTogoTongaTrinidad and TobagoTunisiaTurkeyTurkmenistanTurks and Caicos IslandsTuvaluUgandaUkraineUnited Arab EmiratesUnited KingdomUnited StatesUpper middle incomeUruguayUzbekistanVanuatuVenezuela, RBVietnamVirgin Islands (U.S.)West Bank and GazaWorldYemen, Rep.ZambiaZimbabwe Timeline:
This timeline shows a graph from 1961 to 2016 of Congo, Dem. Rep.. No data until 1960. Number of actual observations by date: 56.
Source name:
World Development Indicators
Source organization:
World Bank Staff estimates based on United Nations, World Urbanization Prospects.
Categories, topics:
Climate Change, Urban Development
Last updated:
apr 23, 2017
Indicators value changes by year
At the date of observation
Value
Absolute change
Change from previous value
jan 1, 1961
4.023
+4.023
0.0%
jan 1, 1962
3.517
-0.506
-12.57%
jan 1, 1963
3.546
+0.029
0.82%
jan 1, 1964
3.582
+0.035
1.0%
jan 1, 1965
3.637
+0.055
1.55%
jan 1, 1966
3.706
+0.069
1.89%
jan 1, 1967
3.778
+0.073
1.96%
jan 1, 1968
3.829
+0.051
1.35%
jan 1, 1969
3.848
+0.019
0.48%
jan 1, 1970
3.818
-0.03
-0.79%
jan 1, 1971
3.764
-0.053
-1.4%
jan 1, 1972
3.694
-0.071
-1.88%
jan 1, 1973
3.646
-0.048
-1.29%
jan 1, 1974
3.621
-0.025
-0.69%
jan 1, 1975
3.649
+0.028
0.77%
jan 1, 1976
3.703
+0.054
1.47%
jan 1, 1977
3.77
+0.067
1.81%
jan 1, 1978
3.821
+0.051
1.35%
jan 1, 1979
3.814
-0.007
-0.17%
jan 1, 1980
3.744
-0.07
-1.84%
jan 1, 1981
3.634
-0.11
-2.93%
jan 1, 1982
3.528
-0.106
-2.92%
jan 1, 1983
3.458
-0.07
-1.98%
jan 1, 1984
3.444
-0.014
-0.41%
jan 1, 1985
3.506
+0.062
1.81%
jan 1, 1986
4.146
+0.64
18.25%
jan 1, 1987
4.226
+0.08
1.92%
jan 1, 1988
4.295
+0.069
1.64%
jan 1, 1989
4.441
+0.146
3.4%
jan 1, 1990
4.658
+0.217
4.88%
jan 1, 1991
4.908
+0.251
5.38%
jan 1, 1992
5.186
+0.277
5.65%
jan 1, 1993
5.384
+0.198
3.82%
jan 1, 1994
5.359
-0.025
-0.46%
jan 1, 1995
5.098
-0.261
-4.88%
jan 1, 1996
4.699
-0.399
-7.83%
jan 1, 1997
4.264
-0.434
-9.25%
jan 1, 1998
3.928
-0.336
-7.89%
jan 1, 1999
3.761
-0.167
-4.25%
jan 1, 2000
3.803
+0.042
1.12%
jan 1, 2001
3.985
+0.182
4.78%
jan 1, 2002
4.188
+0.203
5.09%
jan 1, 2003
4.339
+0.151
3.6%
jan 1, 2004
4.447
+0.108
2.5%
jan 1, 2005
4.493
+0.046
1.04%
jan 1, 2006
4.499
+0.005
0.12%
jan 1, 2007
4.504
+0.005
0.11%
jan 1, 2008
4.516
+0.012
0.26%
jan 1, 2009
4.521
+0.005
0.11%
jan 1, 2010
4.506
-0.014
-0.32%
jan 1, 2011
4.486
-0.02
-0.44%
jan 1, 2012
4.463
-0.023
-0.52%
jan 1, 2013
4.434
-0.029
-0.66%
jan 1, 2014
4.407
-0.027
-0.6%
jan 1, 2015
4.388
-0.019
-0.44%
jan 1, 2016
4.368
-0.019
-0.44%
Ranking of countries by current statistics by years


Comments: