29
/
en
AIzaSyAYiBZKx7MnpbEhh9jyipgxe19OcubqV5w
April 1, 2024
198427
Moldova
MDA
true
2
1
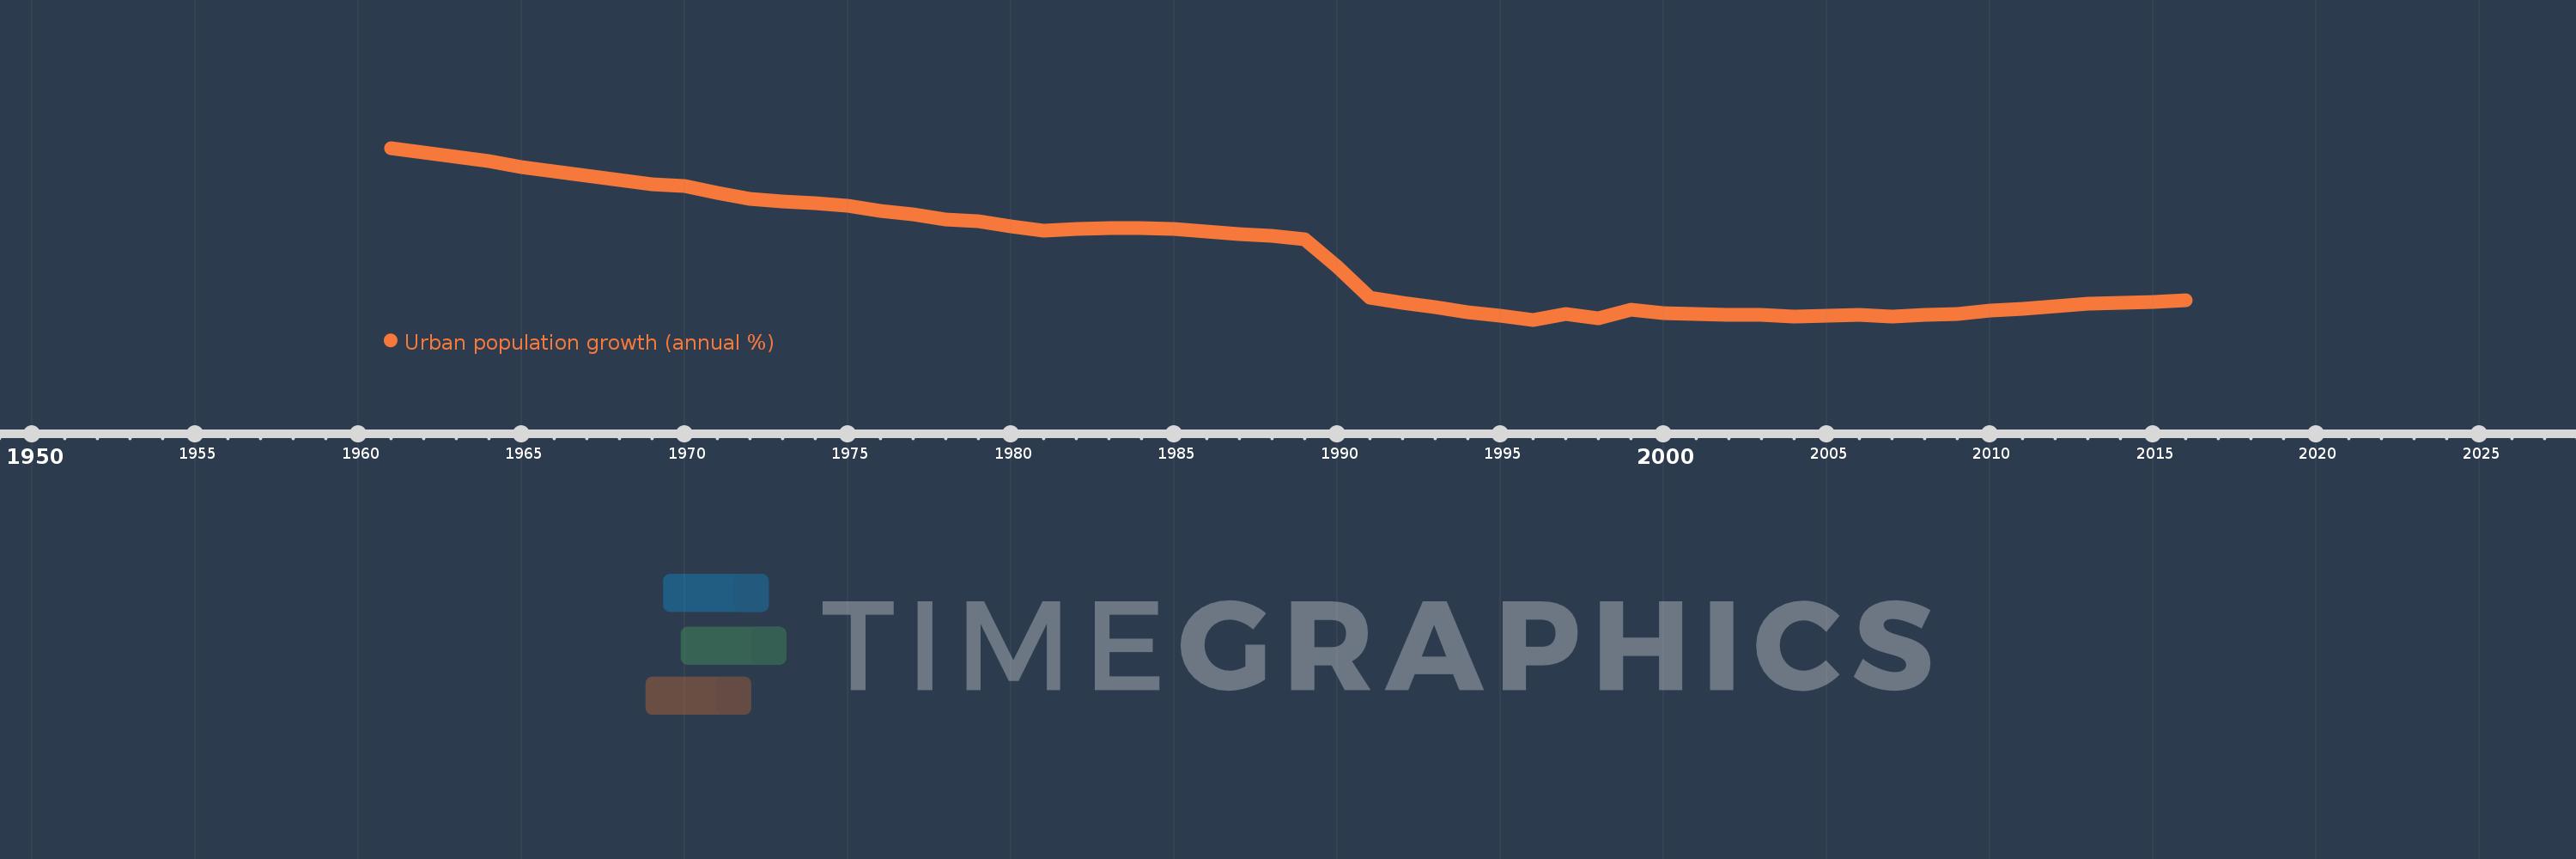
Urban population growth (annual %)
2016,2015,2014,2013,2012,2011,2010,2009,2008,2007,2006,2005,2004,2003,2002,2001,2000,1999,1998,1997,1996,1995,1994,1993,1992,1991,1990,1989,1988,1987,1986,1985,1984,1983,1982,1981,1980,1979,1978,1977,1976,1975,1974,1973,1972,1971,1970,1969,1968,1967,1966,1965,1964,1963,1962,1961
This statistics in other country:
AfghanistanAlbaniaAlgeriaAmerican SamoaAndorraAngolaAntigua and BarbudaArab WorldArgentinaArmeniaArubaAustraliaAustriaAzerbaijanBahamas, TheBahrainBangladeshBarbadosBelarusBelgiumBelizeBeninBermudaBhutanBoliviaBosnia and HerzegovinaBotswanaBrazilBritish Virgin IslandsBrunei DarussalamBulgariaBurkina FasoBurundiCabo VerdeCambodiaCameroonCanadaCaribbean small statesCayman IslandsCentral African RepublicCentral Europe and the BalticsChadChannel IslandsChileChinaColombiaComorosCongo, Dem. Rep.Congo, Rep.Costa RicaCote d'IvoireCroatiaCubaCuracaoCyprusCzech RepublicDenmarkDjiboutiDominicaDominican RepublicEarly-demographic dividendEast Asia & PacificEast Asia & Pacific (excluding high income)East Asia & Pacific (IDA & IBRD countries)EcuadorEgypt, Arab Rep.El SalvadorEquatorial GuineaEritreaEstoniaEthiopiaEuro areaEurope & Central AsiaEurope & Central Asia (excluding high income)Europe & Central Asia (IDA & IBRD countries)European UnionFaroe IslandsFijiFinlandFragile and conflict affected situationsFranceFrench PolynesiaGabonGambia, TheGeorgiaGermanyGhanaGibraltarGreeceGreenlandGrenadaGuamGuatemalaGuineaGuinea-BissauGuyanaHaitiHeavily indebted poor countries (HIPC)High incomeHondurasHong Kong SAR, ChinaHungaryIBRD onlyIcelandIDA & IBRD totalIDA blendIDA onlyIDA totalIndiaIndonesiaIran, Islamic Rep.IraqIrelandIsle of ManIsraelItalyJamaicaJapanJordanKazakhstanKenyaKiribatiKorea, Dem. People’s Rep.Korea, Rep.KuwaitKyrgyz RepublicLao PDRLate-demographic dividendLatin America & Caribbean Latin America & Caribbean (excluding high income)Latin America & the Caribbean (IDA & IBRD countries)LatviaLeast developed countries: UN classificationLebanonLesothoLiberiaLibyaLiechtensteinLithuaniaLow & middle incomeLow incomeLower middle incomeLuxembourgMacao SAR, ChinaMacedonia, FYRMadagascarMalawiMalaysiaMaldivesMaliMaltaMarshall IslandsMauritaniaMauritiusMexicoMicronesia, Fed. Sts.Middle East & North AfricaMiddle East & North Africa (excluding high income)Middle East & North Africa (IDA & IBRD countries)Middle incomeMoldovaMonacoMongoliaMontenegroMoroccoMozambiqueMyanmarNamibiaNauruNepalNetherlandsNew CaledoniaNew ZealandNicaraguaNigerNigeriaNorth AmericaNorthern Mariana IslandsNorwayOECD membersOmanOther small statesPacific island small statesPakistanPalauPanamaPapua New GuineaParaguayPeruPhilippinesPolandPortugalPost-demographic dividendPre-demographic dividendPuerto RicoQatarRomaniaRussian FederationRwandaSamoaSan MarinoSao Tome and PrincipeSaudi ArabiaSenegalSerbiaSeychellesSierra LeoneSingaporeSint Maarten (Dutch part)Slovak RepublicSloveniaSmall statesSolomon IslandsSomaliaSouth AfricaSouth AsiaSouth Asia (IDA & IBRD)South SudanSpainSri LankaSt. Kitts and NevisSt. LuciaSt. Vincent and the GrenadinesSub-Saharan Africa Sub-Saharan Africa (excluding high income)Sub-Saharan Africa (IDA & IBRD countries)SudanSurinameSwazilandSwedenSwitzerlandSyrian Arab RepublicTajikistanTanzaniaThailandTimor-LesteTogoTongaTrinidad and TobagoTunisiaTurkeyTurkmenistanTurks and Caicos IslandsTuvaluUgandaUkraineUnited Arab EmiratesUnited KingdomUnited StatesUpper middle incomeUruguayUzbekistanVanuatuVenezuela, RBVietnamVirgin Islands (U.S.)West Bank and GazaWorldYemen, Rep.ZambiaZimbabwe Timeline:
This timeline shows a graph from 1961 to 2016 of Moldova. No data until 1960. Number of actual observations by date: 56.
Source name:
World Development Indicators
Source organization:
World Bank Staff estimates based on United Nations, World Urbanization Prospects.
Categories, topics:
Climate Change, Urban Development
Last updated:
apr 23, 2017
Indicators value changes by year
Minimum:
-0.632
jan 1, 1996
At the date of observation
Value
Absolute change
Change from previous value
jan 1, 1961
5.877
+5.877
0.0%
jan 1, 1962
5.695
-0.182
-3.1%
jan 1, 1963
5.534
-0.161
-2.83%
jan 1, 1964
5.376
-0.158
-2.85%
jan 1, 1965
5.152
-0.224
-4.16%
jan 1, 1966
5.003
-0.15
-2.91%
jan 1, 1967
4.831
-0.172
-3.44%
jan 1, 1968
4.662
-0.169
-3.49%
jan 1, 1969
4.5
-0.163
-3.49%
jan 1, 1970
4.433
-0.067
-1.48%
jan 1, 1971
4.169
-0.264
-5.96%
jan 1, 1972
3.933
-0.236
-5.66%
jan 1, 1973
3.852
-0.081
-2.05%
jan 1, 1974
3.797
-0.055
-1.43%
jan 1, 1975
3.69
-0.107
-2.82%
jan 1, 1976
3.488
-0.202
-5.47%
jan 1, 1977
3.356
-0.132
-3.77%
jan 1, 1978
3.158
-0.199
-5.93%
jan 1, 1979
3.089
-0.069
-2.17%
jan 1, 1980
2.89
-0.198
-6.43%
jan 1, 1981
2.754
-0.136
-4.71%
jan 1, 1982
2.805
+0.05
1.82%
jan 1, 1983
2.834
+0.03
1.06%
jan 1, 1984
2.827
-0.007
-0.25%
jan 1, 1985
2.797
-0.031
-1.09%
jan 1, 1986
2.702
-0.095
-3.4%
jan 1, 1987
2.616
-0.086
-3.17%
jan 1, 1988
2.556
-0.06
-2.3%
jan 1, 1989
2.419
-0.136
-5.33%
jan 1, 1990
1.361
-1.059
-43.76%
jan 1, 1991
0.206
-1.155
-84.87%
jan 1, 1992
0.017
-0.189
-91.68%
jan 1, 1993
-0.148
-0.165
-962.05%
jan 1, 1994
-0.337
-0.189
128.32%
jan 1, 1995
-0.473
-0.136
40.34%
jan 1, 1996
-0.632
-0.159
33.7%
jan 1, 1997
-0.403
+0.229
-36.21%
jan 1, 1998
-0.584
-0.181
44.86%
jan 1, 1999
-0.255
+0.329
-56.31%
jan 1, 2000
-0.375
-0.119
46.74%
jan 1, 2001
-0.419
-0.045
11.9%
jan 1, 2002
-0.44
-0.021
4.95%
jan 1, 2003
-0.448
-0.008
1.91%
jan 1, 2004
-0.499
-0.05
11.26%
jan 1, 2005
-0.465
+0.034
-6.75%
jan 1, 2006
-0.462
+0.004
-0.79%
jan 1, 2007
-0.497
-0.035
7.6%
jan 1, 2008
-0.451
+0.046
-9.2%
jan 1, 2009
-0.41
+0.041
-9.07%
jan 1, 2010
-0.293
+0.117
-28.55%
jan 1, 2011
-0.211
+0.082
-27.92%
jan 1, 2012
-0.118
+0.093
-44.11%
jan 1, 2013
-0.018
+0.1
-85.09%
jan 1, 2014
0.022
+0.04
-226.69%
jan 1, 2015
0.041
+0.019
85.9%
jan 1, 2016
0.093
+0.051
123.26%
Ranking of countries by current statistics by years


Comments: