29
/
en
AIzaSyAYiBZKx7MnpbEhh9jyipgxe19OcubqV5w
April 1, 2024
74517
Austria
AUT
true
2
1
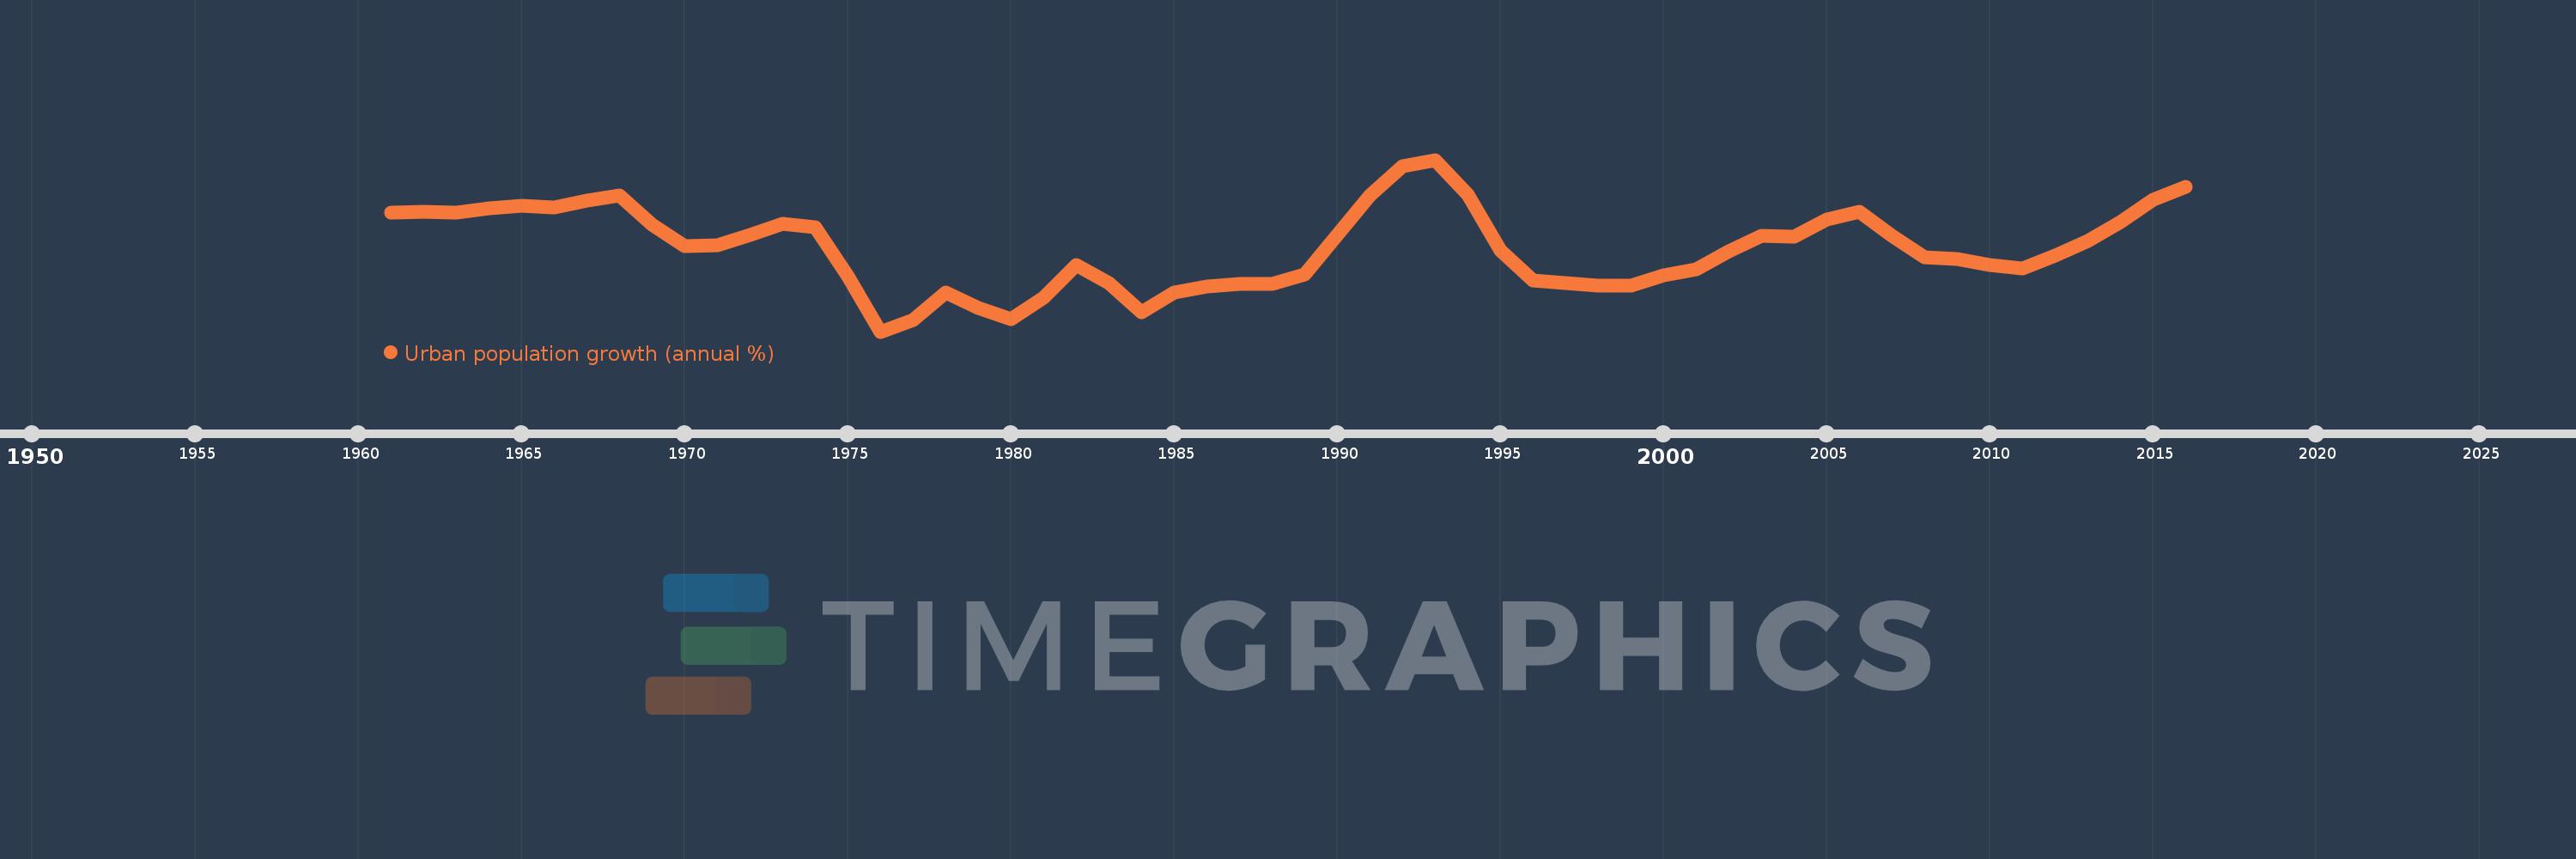
Urban population growth (annual %)
2016,2015,2014,2013,2012,2011,2010,2009,2008,2007,2006,2005,2004,2003,2002,2001,2000,1999,1998,1997,1996,1995,1994,1993,1992,1991,1990,1989,1988,1987,1986,1985,1984,1983,1982,1981,1980,1979,1978,1977,1976,1975,1974,1973,1972,1971,1970,1969,1968,1967,1966,1965,1964,1963,1962,1961
This statistics in other country:
AfghanistanAlbaniaAlgeriaAmerican SamoaAndorraAngolaAntigua and BarbudaArab WorldArgentinaArmeniaArubaAustraliaAustriaAzerbaijanBahamas, TheBahrainBangladeshBarbadosBelarusBelgiumBelizeBeninBermudaBhutanBoliviaBosnia and HerzegovinaBotswanaBrazilBritish Virgin IslandsBrunei DarussalamBulgariaBurkina FasoBurundiCabo VerdeCambodiaCameroonCanadaCaribbean small statesCayman IslandsCentral African RepublicCentral Europe and the BalticsChadChannel IslandsChileChinaColombiaComorosCongo, Dem. Rep.Congo, Rep.Costa RicaCote d'IvoireCroatiaCubaCuracaoCyprusCzech RepublicDenmarkDjiboutiDominicaDominican RepublicEarly-demographic dividendEast Asia & PacificEast Asia & Pacific (excluding high income)East Asia & Pacific (IDA & IBRD countries)EcuadorEgypt, Arab Rep.El SalvadorEquatorial GuineaEritreaEstoniaEthiopiaEuro areaEurope & Central AsiaEurope & Central Asia (excluding high income)Europe & Central Asia (IDA & IBRD countries)European UnionFaroe IslandsFijiFinlandFragile and conflict affected situationsFranceFrench PolynesiaGabonGambia, TheGeorgiaGermanyGhanaGibraltarGreeceGreenlandGrenadaGuamGuatemalaGuineaGuinea-BissauGuyanaHaitiHeavily indebted poor countries (HIPC)High incomeHondurasHong Kong SAR, ChinaHungaryIBRD onlyIcelandIDA & IBRD totalIDA blendIDA onlyIDA totalIndiaIndonesiaIran, Islamic Rep.IraqIrelandIsle of ManIsraelItalyJamaicaJapanJordanKazakhstanKenyaKiribatiKorea, Dem. People’s Rep.Korea, Rep.KuwaitKyrgyz RepublicLao PDRLate-demographic dividendLatin America & Caribbean Latin America & Caribbean (excluding high income)Latin America & the Caribbean (IDA & IBRD countries)LatviaLeast developed countries: UN classificationLebanonLesothoLiberiaLibyaLiechtensteinLithuaniaLow & middle incomeLow incomeLower middle incomeLuxembourgMacao SAR, ChinaMacedonia, FYRMadagascarMalawiMalaysiaMaldivesMaliMaltaMarshall IslandsMauritaniaMauritiusMexicoMicronesia, Fed. Sts.Middle East & North AfricaMiddle East & North Africa (excluding high income)Middle East & North Africa (IDA & IBRD countries)Middle incomeMoldovaMonacoMongoliaMontenegroMoroccoMozambiqueMyanmarNamibiaNauruNepalNetherlandsNew CaledoniaNew ZealandNicaraguaNigerNigeriaNorth AmericaNorthern Mariana IslandsNorwayOECD membersOmanOther small statesPacific island small statesPakistanPalauPanamaPapua New GuineaParaguayPeruPhilippinesPolandPortugalPost-demographic dividendPre-demographic dividendPuerto RicoQatarRomaniaRussian FederationRwandaSamoaSan MarinoSao Tome and PrincipeSaudi ArabiaSenegalSerbiaSeychellesSierra LeoneSingaporeSint Maarten (Dutch part)Slovak RepublicSloveniaSmall statesSolomon IslandsSomaliaSouth AfricaSouth AsiaSouth Asia (IDA & IBRD)South SudanSpainSri LankaSt. Kitts and NevisSt. LuciaSt. Vincent and the GrenadinesSub-Saharan Africa Sub-Saharan Africa (excluding high income)Sub-Saharan Africa (IDA & IBRD countries)SudanSurinameSwazilandSwedenSwitzerlandSyrian Arab RepublicTajikistanTanzaniaThailandTimor-LesteTogoTongaTrinidad and TobagoTunisiaTurkeyTurkmenistanTurks and Caicos IslandsTuvaluUgandaUkraineUnited Arab EmiratesUnited KingdomUnited StatesUpper middle incomeUruguayUzbekistanVanuatuVenezuela, RBVietnamVirgin Islands (U.S.)West Bank and GazaWorldYemen, Rep.ZambiaZimbabwe Timeline:
This timeline shows a graph from 1961 to 2016 of Austria. No data until 1960. Number of actual observations by date: 56.
Source name:
World Development Indicators
Source organization:
World Bank Staff estimates based on United Nations, World Urbanization Prospects.
Categories, topics:
Climate Change, Urban Development
Last updated:
apr 23, 2017
Indicators value changes by year
At the date of observation
Value
Absolute change
Change from previous value
jan 1, 1961
0.684
+0.684
0.0%
jan 1, 1962
0.694
+0.01
1.41%
jan 1, 1963
0.688
-0.005
-0.74%
jan 1, 1964
0.719
+0.031
4.49%
jan 1, 1965
0.742
+0.023
3.14%
jan 1, 1966
0.725
-0.017
-2.28%
jan 1, 1967
0.778
+0.053
7.33%
jan 1, 1968
0.823
+0.044
5.71%
jan 1, 1969
0.594
-0.228
-27.74%
jan 1, 1970
0.421
-0.174
-29.26%
jan 1, 1971
0.426
+0.005
1.27%
jan 1, 1972
0.512
+0.086
20.25%
jan 1, 1973
0.596
+0.084
16.48%
jan 1, 1974
0.569
-0.027
-4.55%
jan 1, 1975
0.186
-0.384
-67.41%
jan 1, 1976
-0.25
-0.436
-234.76%
jan 1, 1977
-0.161
+0.089
-35.46%
jan 1, 1978
0.054
+0.215
-133.28%
jan 1, 1979
-0.066
-0.119
-222.3%
jan 1, 1980
-0.155
-0.089
136.22%
jan 1, 1981
0.015
+0.171
-109.92%
jan 1, 1982
0.276
+0.261
1.7K%
jan 1, 1983
0.134
-0.142
-51.38%
jan 1, 1984
-0.101
-0.235
-174.8%
jan 1, 1985
0.055
+0.155
-154.49%
jan 1, 1986
0.108
+0.053
97.15%
jan 1, 1987
0.125
+0.017
15.33%
jan 1, 1988
0.124
0.0
-0.24%
jan 1, 1989
0.202
+0.078
62.97%
jan 1, 1990
0.51
+0.307
151.82%
jan 1, 1991
0.823
+0.313
61.38%
jan 1, 1992
1.052
+0.229
27.8%
jan 1, 1993
1.101
+0.049
4.65%
jan 1, 1994
0.825
-0.276
-25.07%
jan 1, 1995
0.385
-0.44
-53.33%
jan 1, 1996
0.153
-0.232
-60.22%
jan 1, 1997
0.135
-0.018
-11.81%
jan 1, 1998
0.113
-0.022
-16.07%
jan 1, 1999
0.11
-0.004
-3.17%
jan 1, 2000
0.195
+0.085
77.32%
jan 1, 2001
0.24
+0.046
23.59%
jan 1, 2002
0.384
+0.144
59.83%
jan 1, 2003
0.5
+0.115
29.99%
jan 1, 2004
0.496
-0.003
-0.67%
jan 1, 2005
0.63
+0.133
26.86%
jan 1, 2006
0.69
+0.061
9.66%
jan 1, 2007
0.502
-0.188
-27.23%
jan 1, 2008
0.333
-0.169
-33.67%
jan 1, 2009
0.322
-0.011
-3.33%
jan 1, 2010
0.271
-0.051
-15.86%
jan 1, 2011
0.248
-0.023
-8.52%
jan 1, 2012
0.346
+0.098
39.6%
jan 1, 2013
0.465
+0.119
34.34%
jan 1, 2014
0.614
+0.149
32.13%
jan 1, 2015
0.784
+0.17
27.59%
jan 1, 2016
0.885
+0.101
12.86%
Ranking of countries by current statistics by years


Comments: