29
/
en
AIzaSyAYiBZKx7MnpbEhh9jyipgxe19OcubqV5w
April 1, 2024
255959
Swaziland
SWZ
true
2
1
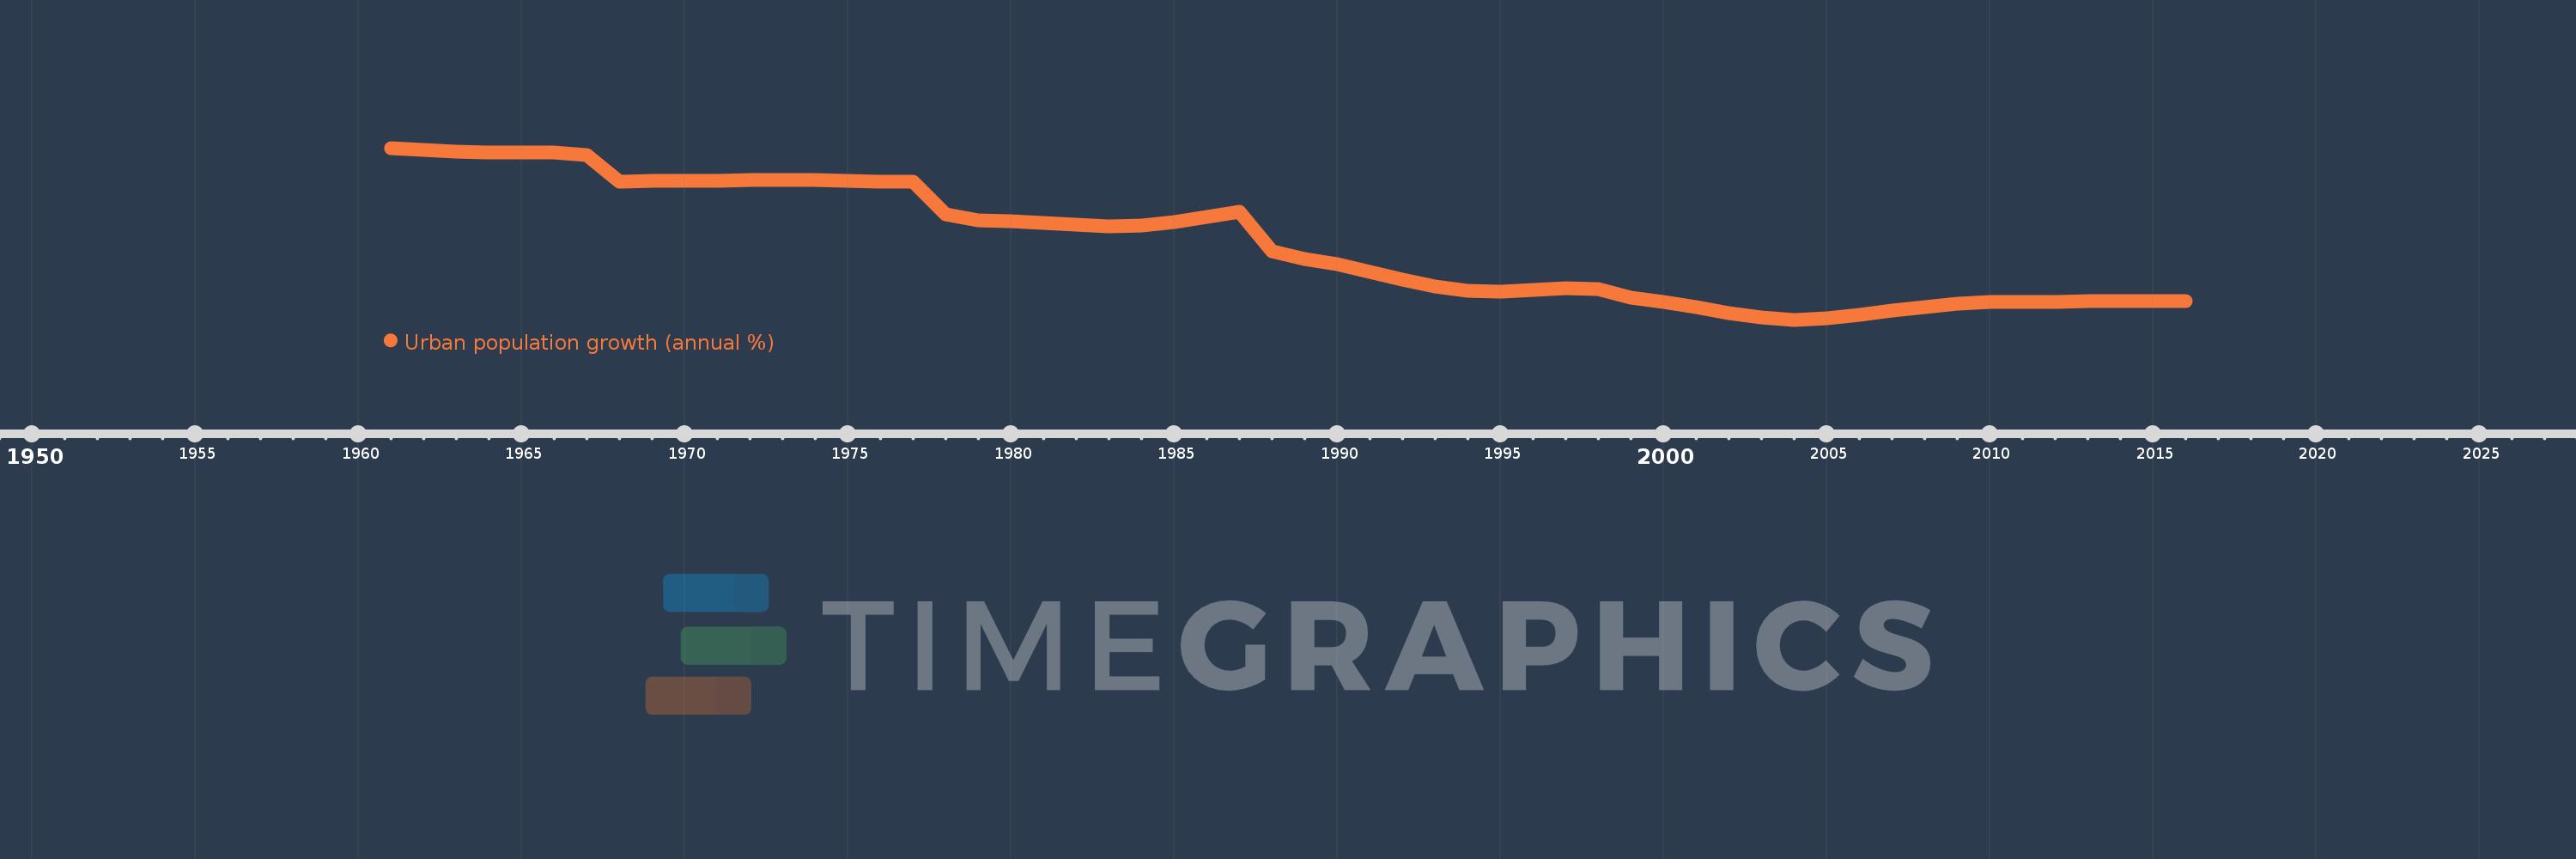
Urban population growth (annual %)
2016,2015,2014,2013,2012,2011,2010,2009,2008,2007,2006,2005,2004,2003,2002,2001,2000,1999,1998,1997,1996,1995,1994,1993,1992,1991,1990,1989,1988,1987,1986,1985,1984,1983,1982,1981,1980,1979,1978,1977,1976,1975,1974,1973,1972,1971,1970,1969,1968,1967,1966,1965,1964,1963,1962,1961
This statistics in other country:
AfghanistanAlbaniaAlgeriaAmerican SamoaAndorraAngolaAntigua and BarbudaArab WorldArgentinaArmeniaArubaAustraliaAustriaAzerbaijanBahamas, TheBahrainBangladeshBarbadosBelarusBelgiumBelizeBeninBermudaBhutanBoliviaBosnia and HerzegovinaBotswanaBrazilBritish Virgin IslandsBrunei DarussalamBulgariaBurkina FasoBurundiCabo VerdeCambodiaCameroonCanadaCaribbean small statesCayman IslandsCentral African RepublicCentral Europe and the BalticsChadChannel IslandsChileChinaColombiaComorosCongo, Dem. Rep.Congo, Rep.Costa RicaCote d'IvoireCroatiaCubaCuracaoCyprusCzech RepublicDenmarkDjiboutiDominicaDominican RepublicEarly-demographic dividendEast Asia & PacificEast Asia & Pacific (excluding high income)East Asia & Pacific (IDA & IBRD countries)EcuadorEgypt, Arab Rep.El SalvadorEquatorial GuineaEritreaEstoniaEthiopiaEuro areaEurope & Central AsiaEurope & Central Asia (excluding high income)Europe & Central Asia (IDA & IBRD countries)European UnionFaroe IslandsFijiFinlandFragile and conflict affected situationsFranceFrench PolynesiaGabonGambia, TheGeorgiaGermanyGhanaGibraltarGreeceGreenlandGrenadaGuamGuatemalaGuineaGuinea-BissauGuyanaHaitiHeavily indebted poor countries (HIPC)High incomeHondurasHong Kong SAR, ChinaHungaryIBRD onlyIcelandIDA & IBRD totalIDA blendIDA onlyIDA totalIndiaIndonesiaIran, Islamic Rep.IraqIrelandIsle of ManIsraelItalyJamaicaJapanJordanKazakhstanKenyaKiribatiKorea, Dem. People’s Rep.Korea, Rep.KuwaitKyrgyz RepublicLao PDRLate-demographic dividendLatin America & Caribbean Latin America & Caribbean (excluding high income)Latin America & the Caribbean (IDA & IBRD countries)LatviaLeast developed countries: UN classificationLebanonLesothoLiberiaLibyaLiechtensteinLithuaniaLow & middle incomeLow incomeLower middle incomeLuxembourgMacao SAR, ChinaMacedonia, FYRMadagascarMalawiMalaysiaMaldivesMaliMaltaMarshall IslandsMauritaniaMauritiusMexicoMicronesia, Fed. Sts.Middle East & North AfricaMiddle East & North Africa (excluding high income)Middle East & North Africa (IDA & IBRD countries)Middle incomeMoldovaMonacoMongoliaMontenegroMoroccoMozambiqueMyanmarNamibiaNauruNepalNetherlandsNew CaledoniaNew ZealandNicaraguaNigerNigeriaNorth AmericaNorthern Mariana IslandsNorwayOECD membersOmanOther small statesPacific island small statesPakistanPalauPanamaPapua New GuineaParaguayPeruPhilippinesPolandPortugalPost-demographic dividendPre-demographic dividendPuerto RicoQatarRomaniaRussian FederationRwandaSamoaSan MarinoSao Tome and PrincipeSaudi ArabiaSenegalSerbiaSeychellesSierra LeoneSingaporeSint Maarten (Dutch part)Slovak RepublicSloveniaSmall statesSolomon IslandsSomaliaSouth AfricaSouth AsiaSouth Asia (IDA & IBRD)South SudanSpainSri LankaSt. Kitts and NevisSt. LuciaSt. Vincent and the GrenadinesSub-Saharan Africa Sub-Saharan Africa (excluding high income)Sub-Saharan Africa (IDA & IBRD countries)SudanSurinameSwazilandSwedenSwitzerlandSyrian Arab RepublicTajikistanTanzaniaThailandTimor-LesteTogoTongaTrinidad and TobagoTunisiaTurkeyTurkmenistanTurks and Caicos IslandsTuvaluUgandaUkraineUnited Arab EmiratesUnited KingdomUnited StatesUpper middle incomeUruguayUzbekistanVanuatuVenezuela, RBVietnamVirgin Islands (U.S.)West Bank and GazaWorldYemen, Rep.ZambiaZimbabwe Timeline:
This timeline shows a graph from 1961 to 2016 of Swaziland. No data until 1960. Number of actual observations by date: 56.
Source name:
World Development Indicators
Source organization:
World Bank Staff estimates based on United Nations, World Urbanization Prospects.
Categories, topics:
Climate Change, Urban Development
Last updated:
apr 23, 2017
Indicators value changes by year
Minimum:
-0.047
jan 1, 2004
At the date of observation
Value
Absolute change
Change from previous value
jan 1, 1961
12.71
+12.71
0.0%
jan 1, 1962
12.594
-0.116
-0.92%
jan 1, 1963
12.456
-0.137
-1.09%
jan 1, 1964
12.367
-0.089
-0.72%
jan 1, 1965
12.362
-0.005
-0.04%
jan 1, 1966
12.346
-0.016
-0.13%
jan 1, 1967
12.154
-0.192
-1.55%
jan 1, 1968
10.193
-1.961
-16.13%
jan 1, 1969
10.245
+0.052
0.51%
jan 1, 1970
10.252
+0.007
0.07%
jan 1, 1971
10.29
+0.038
0.37%
jan 1, 1972
10.32
+0.03
0.29%
jan 1, 1973
10.35
+0.029
0.28%
jan 1, 1974
10.312
-0.038
-0.37%
jan 1, 1975
10.286
-0.026
-0.25%
jan 1, 1976
10.23
-0.056
-0.54%
jan 1, 1977
10.195
-0.036
-0.35%
jan 1, 1978
7.767
-2.428
-23.82%
jan 1, 1979
7.307
-0.459
-5.91%
jan 1, 1980
7.24
-0.068
-0.93%
jan 1, 1981
7.165
-0.075
-1.03%
jan 1, 1982
7.009
-0.156
-2.17%
jan 1, 1983
6.908
-0.101
-1.45%
jan 1, 1984
6.963
+0.055
0.8%
jan 1, 1985
7.221
+0.258
3.71%
jan 1, 1986
7.567
+0.346
4.79%
jan 1, 1987
7.955
+0.389
5.13%
jan 1, 1988
5.03
-2.925
-36.77%
jan 1, 1989
4.45
-0.581
-11.54%
jan 1, 1990
4.09
-0.36
-8.09%
jan 1, 1991
3.535
-0.555
-13.57%
jan 1, 1992
2.92
-0.615
-17.39%
jan 1, 1993
2.433
-0.487
-16.69%
jan 1, 1994
2.115
-0.318
-13.07%
jan 1, 1995
2.046
-0.068
-3.22%
jan 1, 1996
2.135
+0.089
4.34%
jan 1, 1997
2.286
+0.151
7.05%
jan 1, 1998
2.257
-0.029
-1.27%
jan 1, 1999
1.582
-0.675
-29.9%
jan 1, 2000
1.297
-0.285
-18.0%
jan 1, 2001
0.898
-0.399
-30.78%
jan 1, 2002
0.454
-0.443
-49.39%
jan 1, 2003
0.111
-0.343
-75.59%
jan 1, 2004
-0.047
-0.157
-141.99%
jan 1, 2005
0.041
+0.087
-187.61%
jan 1, 2006
0.318
+0.277
679.41%
jan 1, 2007
0.638
+0.32
100.46%
jan 1, 2008
0.897
+0.259
40.66%
jan 1, 2009
1.131
+0.235
26.17%
jan 1, 2010
1.256
+0.124
10.97%
jan 1, 2011
1.277
+0.021
1.71%
jan 1, 2012
1.293
+0.016
1.27%
jan 1, 2013
1.336
+0.042
3.28%
jan 1, 2014
1.353
+0.018
1.32%
jan 1, 2015
1.363
+0.01
0.71%
jan 1, 2016
1.365
+0.002
0.13%
Ranking of countries by current statistics by years


Comments: