29
/
en
AIzaSyAYiBZKx7MnpbEhh9jyipgxe19OcubqV5w
April 1, 2024
54510
Pacific island small states
PSS
false
2
1
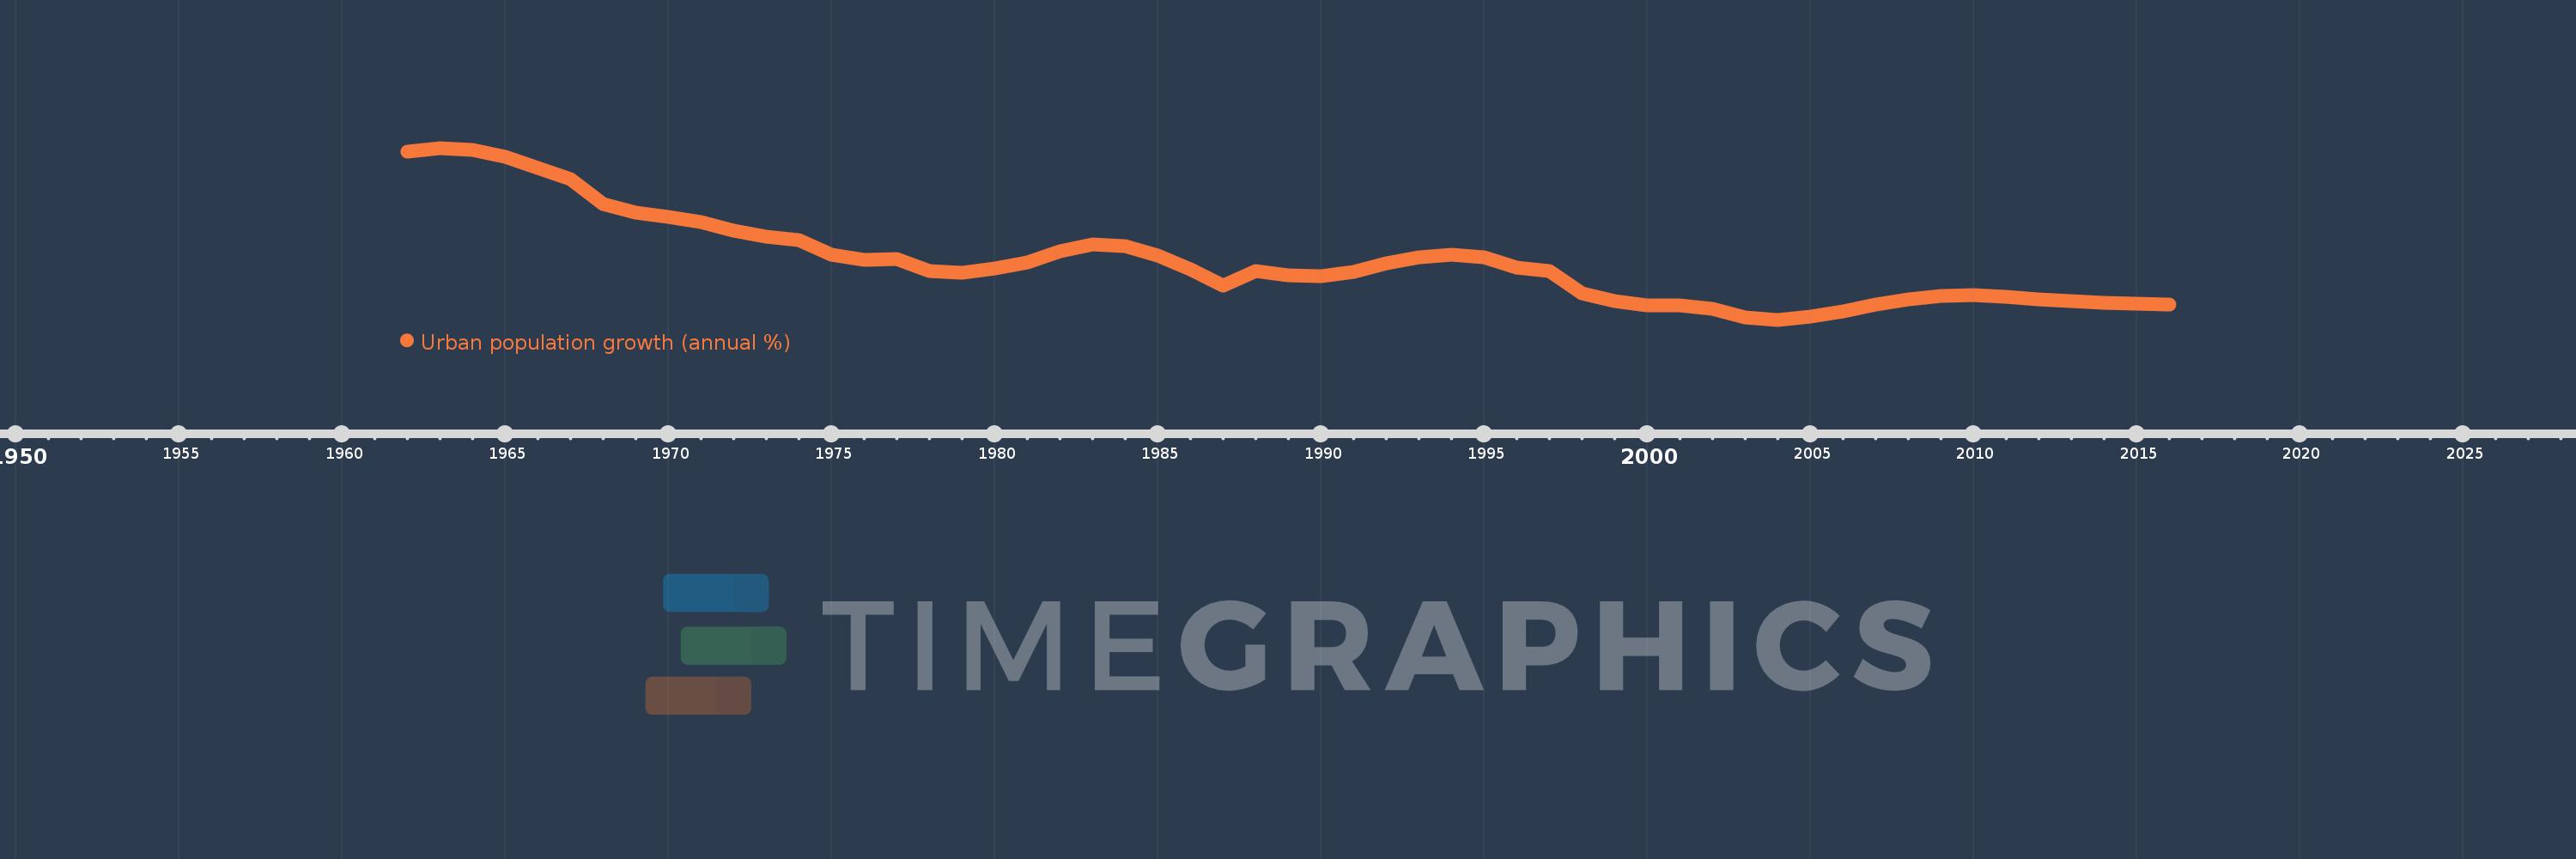
Urban population growth (annual %)
2016,2015,2014,2013,2012,2011,2010,2009,2008,2007,2006,2005,2004,2003,2002,2001,2000,1999,1998,1997,1996,1995,1994,1993,1992,1991,1990,1989,1988,1987,1986,1985,1984,1983,1982,1981,1980,1979,1978,1977,1976,1975,1974,1973,1972,1971,1970,1969,1968,1967,1966,1965,1964,1963,1962
This statistics in other country:
AfghanistanAlbaniaAlgeriaAmerican SamoaAndorraAngolaAntigua and BarbudaArab WorldArgentinaArmeniaArubaAustraliaAustriaAzerbaijanBahamas, TheBahrainBangladeshBarbadosBelarusBelgiumBelizeBeninBermudaBhutanBoliviaBosnia and HerzegovinaBotswanaBrazilBritish Virgin IslandsBrunei DarussalamBulgariaBurkina FasoBurundiCabo VerdeCambodiaCameroonCanadaCaribbean small statesCayman IslandsCentral African RepublicCentral Europe and the BalticsChadChannel IslandsChileChinaColombiaComorosCongo, Dem. Rep.Congo, Rep.Costa RicaCote d'IvoireCroatiaCubaCuracaoCyprusCzech RepublicDenmarkDjiboutiDominicaDominican RepublicEarly-demographic dividendEast Asia & PacificEast Asia & Pacific (excluding high income)East Asia & Pacific (IDA & IBRD countries)EcuadorEgypt, Arab Rep.El SalvadorEquatorial GuineaEritreaEstoniaEthiopiaEuro areaEurope & Central AsiaEurope & Central Asia (excluding high income)Europe & Central Asia (IDA & IBRD countries)European UnionFaroe IslandsFijiFinlandFragile and conflict affected situationsFranceFrench PolynesiaGabonGambia, TheGeorgiaGermanyGhanaGibraltarGreeceGreenlandGrenadaGuamGuatemalaGuineaGuinea-BissauGuyanaHaitiHeavily indebted poor countries (HIPC)High incomeHondurasHong Kong SAR, ChinaHungaryIBRD onlyIcelandIDA & IBRD totalIDA blendIDA onlyIDA totalIndiaIndonesiaIran, Islamic Rep.IraqIrelandIsle of ManIsraelItalyJamaicaJapanJordanKazakhstanKenyaKiribatiKorea, Dem. People’s Rep.Korea, Rep.KuwaitKyrgyz RepublicLao PDRLate-demographic dividendLatin America & Caribbean Latin America & Caribbean (excluding high income)Latin America & the Caribbean (IDA & IBRD countries)LatviaLeast developed countries: UN classificationLebanonLesothoLiberiaLibyaLiechtensteinLithuaniaLow & middle incomeLow incomeLower middle incomeLuxembourgMacao SAR, ChinaMacedonia, FYRMadagascarMalawiMalaysiaMaldivesMaliMaltaMarshall IslandsMauritaniaMauritiusMexicoMicronesia, Fed. Sts.Middle East & North AfricaMiddle East & North Africa (excluding high income)Middle East & North Africa (IDA & IBRD countries)Middle incomeMoldovaMonacoMongoliaMontenegroMoroccoMozambiqueMyanmarNamibiaNauruNepalNetherlandsNew CaledoniaNew ZealandNicaraguaNigerNigeriaNorth AmericaNorthern Mariana IslandsNorwayOECD membersOmanOther small statesPacific island small statesPakistanPalauPanamaPapua New GuineaParaguayPeruPhilippinesPolandPortugalPost-demographic dividendPre-demographic dividendPuerto RicoQatarRomaniaRussian FederationRwandaSamoaSan MarinoSao Tome and PrincipeSaudi ArabiaSenegalSerbiaSeychellesSierra LeoneSingaporeSint Maarten (Dutch part)Slovak RepublicSloveniaSmall statesSolomon IslandsSomaliaSouth AfricaSouth AsiaSouth Asia (IDA & IBRD)South SudanSpainSri LankaSt. Kitts and NevisSt. LuciaSt. Vincent and the GrenadinesSub-Saharan Africa Sub-Saharan Africa (excluding high income)Sub-Saharan Africa (IDA & IBRD countries)SudanSurinameSwazilandSwedenSwitzerlandSyrian Arab RepublicTajikistanTanzaniaThailandTimor-LesteTogoTongaTrinidad and TobagoTunisiaTurkeyTurkmenistanTurks and Caicos IslandsTuvaluUgandaUkraineUnited Arab EmiratesUnited KingdomUnited StatesUpper middle incomeUruguayUzbekistanVanuatuVenezuela, RBVietnamVirgin Islands (U.S.)West Bank and GazaWorldYemen, Rep.ZambiaZimbabwe Timeline:
This timeline shows a graph from 1962 to 2016 of Pacific island small states. No data until 1961. Number of actual observations by date: 55.
Source name:
World Development Indicators
Source organization:
World Bank Staff estimates based on United Nations, World Urbanization Prospects.
Categories, topics:
Climate Change, Urban Development
Last updated:
apr 23, 2017
Indicators value changes by year
At the date of observation
Value
Absolute change
Change from previous value
jan 1, 1962
5.287
+5.287
0.0%
jan 1, 1963
5.376
+0.088
1.67%
jan 1, 1964
5.337
-0.039
-0.73%
jan 1, 1965
5.174
-0.162
-3.04%
jan 1, 1966
4.918
-0.256
-4.95%
jan 1, 1967
4.663
-0.254
-5.17%
jan 1, 1968
4.106
-0.557
-11.94%
jan 1, 1969
3.9
-0.207
-5.03%
jan 1, 1970
3.812
-0.088
-2.24%
jan 1, 1971
3.683
-0.129
-3.38%
jan 1, 1972
3.498
-0.186
-5.04%
jan 1, 1973
3.368
-0.13
-3.72%
jan 1, 1974
3.281
-0.087
-2.59%
jan 1, 1975
2.957
-0.324
-9.87%
jan 1, 1976
2.84
-0.117
-3.95%
jan 1, 1977
2.847
+0.007
0.25%
jan 1, 1978
2.584
-0.263
-9.23%
jan 1, 1979
2.549
-0.035
-1.37%
jan 1, 1980
2.643
+0.094
3.69%
jan 1, 1981
2.785
+0.142
5.38%
jan 1, 1982
3.039
+0.254
9.12%
jan 1, 1983
3.183
+0.144
4.74%
jan 1, 1984
3.156
-0.027
-0.85%
jan 1, 1985
2.941
-0.216
-6.83%
jan 1, 1986
2.612
-0.329
-11.18%
jan 1, 1987
2.25
-0.362
-13.84%
jan 1, 1988
2.584
+0.334
14.83%
jan 1, 1989
2.486
-0.098
-3.8%
jan 1, 1990
2.467
-0.019
-0.76%
jan 1, 1991
2.565
+0.098
3.98%
jan 1, 1992
2.754
+0.189
7.37%
jan 1, 1993
2.896
+0.142
5.16%
jan 1, 1994
2.95
+0.054
1.85%
jan 1, 1995
2.886
-0.064
-2.17%
jan 1, 1996
2.665
-0.22
-7.64%
jan 1, 1997
2.573
-0.092
-3.45%
jan 1, 1998
2.078
-0.495
-19.24%
jan 1, 1999
1.901
-0.177
-8.51%
jan 1, 2000
1.801
-0.1
-5.27%
jan 1, 2001
1.806
+0.005
0.25%
jan 1, 2002
1.732
-0.074
-4.09%
jan 1, 2003
1.521
-0.211
-12.2%
jan 1, 2004
1.475
-0.046
-3.01%
jan 1, 2005
1.544
+0.069
4.7%
jan 1, 2006
1.666
+0.122
7.89%
jan 1, 2007
1.813
+0.147
8.82%
jan 1, 2008
1.939
+0.126
6.97%
jan 1, 2009
2.021
+0.081
4.2%
jan 1, 2010
2.026
+0.005
0.25%
jan 1, 2011
1.989
-0.037
-1.83%
jan 1, 2012
1.936
-0.053
-2.66%
jan 1, 2013
1.894
-0.042
-2.17%
jan 1, 2014
1.861
-0.032
-1.71%
jan 1, 2015
1.836
-0.025
-1.34%
jan 1, 2016
1.815
-0.021
-1.17%
Ranking of countries by current statistics by years


Comments: