29
/
en
AIzaSyAYiBZKx7MnpbEhh9jyipgxe19OcubqV5w
April 1, 2024
141466
Gibraltar
GIB
true
2
1
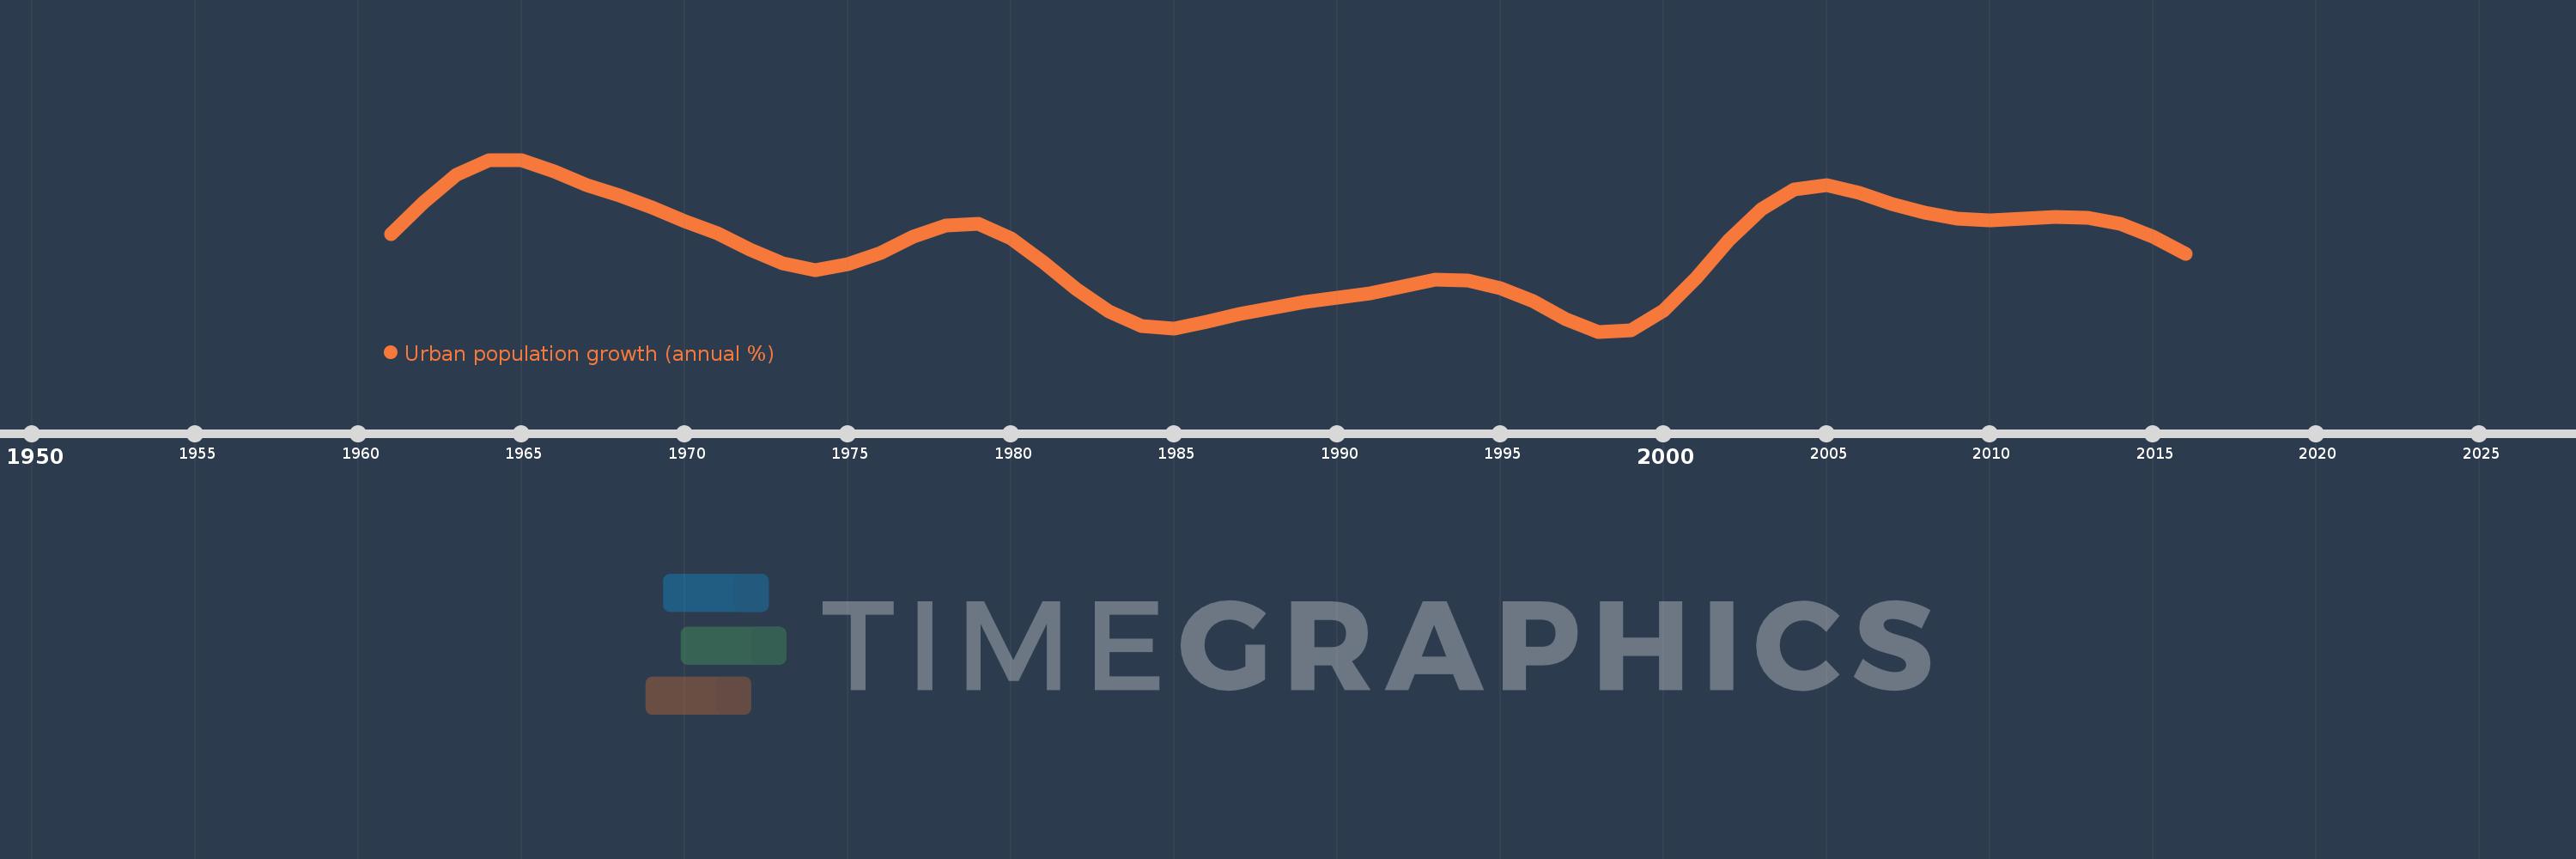
Urban population growth (annual %)
2016,2015,2014,2013,2012,2011,2010,2009,2008,2007,2006,2005,2004,2003,2002,2001,2000,1999,1998,1997,1996,1995,1994,1993,1992,1991,1990,1989,1988,1987,1986,1985,1984,1983,1982,1981,1980,1979,1978,1977,1976,1975,1974,1973,1972,1971,1970,1969,1968,1967,1966,1965,1964,1963,1962,1961
This statistics in other country:
AfghanistanAlbaniaAlgeriaAmerican SamoaAndorraAngolaAntigua and BarbudaArab WorldArgentinaArmeniaArubaAustraliaAustriaAzerbaijanBahamas, TheBahrainBangladeshBarbadosBelarusBelgiumBelizeBeninBermudaBhutanBoliviaBosnia and HerzegovinaBotswanaBrazilBritish Virgin IslandsBrunei DarussalamBulgariaBurkina FasoBurundiCabo VerdeCambodiaCameroonCanadaCaribbean small statesCayman IslandsCentral African RepublicCentral Europe and the BalticsChadChannel IslandsChileChinaColombiaComorosCongo, Dem. Rep.Congo, Rep.Costa RicaCote d'IvoireCroatiaCubaCuracaoCyprusCzech RepublicDenmarkDjiboutiDominicaDominican RepublicEarly-demographic dividendEast Asia & PacificEast Asia & Pacific (excluding high income)East Asia & Pacific (IDA & IBRD countries)EcuadorEgypt, Arab Rep.El SalvadorEquatorial GuineaEritreaEstoniaEthiopiaEuro areaEurope & Central AsiaEurope & Central Asia (excluding high income)Europe & Central Asia (IDA & IBRD countries)European UnionFaroe IslandsFijiFinlandFragile and conflict affected situationsFranceFrench PolynesiaGabonGambia, TheGeorgiaGermanyGhanaGibraltarGreeceGreenlandGrenadaGuamGuatemalaGuineaGuinea-BissauGuyanaHaitiHeavily indebted poor countries (HIPC)High incomeHondurasHong Kong SAR, ChinaHungaryIBRD onlyIcelandIDA & IBRD totalIDA blendIDA onlyIDA totalIndiaIndonesiaIran, Islamic Rep.IraqIrelandIsle of ManIsraelItalyJamaicaJapanJordanKazakhstanKenyaKiribatiKorea, Dem. People’s Rep.Korea, Rep.KuwaitKyrgyz RepublicLao PDRLate-demographic dividendLatin America & Caribbean Latin America & Caribbean (excluding high income)Latin America & the Caribbean (IDA & IBRD countries)LatviaLeast developed countries: UN classificationLebanonLesothoLiberiaLibyaLiechtensteinLithuaniaLow & middle incomeLow incomeLower middle incomeLuxembourgMacao SAR, ChinaMacedonia, FYRMadagascarMalawiMalaysiaMaldivesMaliMaltaMarshall IslandsMauritaniaMauritiusMexicoMicronesia, Fed. Sts.Middle East & North AfricaMiddle East & North Africa (excluding high income)Middle East & North Africa (IDA & IBRD countries)Middle incomeMoldovaMonacoMongoliaMontenegroMoroccoMozambiqueMyanmarNamibiaNauruNepalNetherlandsNew CaledoniaNew ZealandNicaraguaNigerNigeriaNorth AmericaNorthern Mariana IslandsNorwayOECD membersOmanOther small statesPacific island small statesPakistanPalauPanamaPapua New GuineaParaguayPeruPhilippinesPolandPortugalPost-demographic dividendPre-demographic dividendPuerto RicoQatarRomaniaRussian FederationRwandaSamoaSan MarinoSao Tome and PrincipeSaudi ArabiaSenegalSerbiaSeychellesSierra LeoneSingaporeSint Maarten (Dutch part)Slovak RepublicSloveniaSmall statesSolomon IslandsSomaliaSouth AfricaSouth AsiaSouth Asia (IDA & IBRD)South SudanSpainSri LankaSt. Kitts and NevisSt. LuciaSt. Vincent and the GrenadinesSub-Saharan Africa Sub-Saharan Africa (excluding high income)Sub-Saharan Africa (IDA & IBRD countries)SudanSurinameSwazilandSwedenSwitzerlandSyrian Arab RepublicTajikistanTanzaniaThailandTimor-LesteTogoTongaTrinidad and TobagoTunisiaTurkeyTurkmenistanTurks and Caicos IslandsTuvaluUgandaUkraineUnited Arab EmiratesUnited KingdomUnited StatesUpper middle incomeUruguayUzbekistanVanuatuVenezuela, RBVietnamVirgin Islands (U.S.)West Bank and GazaWorldYemen, Rep.ZambiaZimbabwe Timeline:
This timeline shows a graph from 1961 to 2016 of Gibraltar. No data until 1960. Number of actual observations by date: 56.
Source name:
World Development Indicators
Source organization:
World Bank Staff estimates based on United Nations, World Urbanization Prospects.
Categories, topics:
Climate Change, Urban Development
Last updated:
apr 23, 2017
Indicators value changes by year
Minimum:
-0.139
jan 1, 1998
At the date of observation
Value
Absolute change
Change from previous value
jan 1, 1961
0.901
+0.901
0.0%
jan 1, 1962
1.237
+0.337
37.38%
jan 1, 1963
1.53
+0.293
23.65%
jan 1, 1964
1.689
+0.159
10.41%
jan 1, 1965
1.692
+0.003
0.15%
jan 1, 1966
1.569
-0.123
-7.25%
jan 1, 1967
1.426
-0.143
-9.11%
jan 1, 1968
1.31
-0.116
-8.15%
jan 1, 1969
1.181
-0.129
-9.81%
jan 1, 1970
1.041
-0.141
-11.9%
jan 1, 1971
0.908
-0.132
-12.71%
jan 1, 1972
0.739
-0.169
-18.61%
jan 1, 1973
0.59
-0.149
-20.2%
jan 1, 1974
0.519
-0.071
-12.05%
jan 1, 1975
0.576
+0.057
10.93%
jan 1, 1976
0.698
+0.123
21.29%
jan 1, 1977
0.873
+0.175
25.0%
jan 1, 1978
0.992
+0.12
13.73%
jan 1, 1979
1.009
+0.017
1.71%
jan 1, 1980
0.852
-0.158
-15.62%
jan 1, 1981
0.6
-0.252
-29.53%
jan 1, 1982
0.312
-0.288
-48.04%
jan 1, 1983
0.075
-0.237
-75.95%
jan 1, 1984
-0.079
-0.154
-205.0%
jan 1, 1985
-0.109
-0.03
38.22%
jan 1, 1986
-0.038
+0.071
-65.49%
jan 1, 1987
0.045
+0.083
-220.0%
jan 1, 1988
0.113
+0.068
149.8%
jan 1, 1989
0.176
+0.064
56.44%
jan 1, 1990
0.224
+0.048
27.4%
jan 1, 1991
0.272
+0.048
21.36%
jan 1, 1992
0.339
+0.066
24.28%
jan 1, 1993
0.411
+0.073
21.52%
jan 1, 1994
0.41
-0.002
-0.41%
jan 1, 1995
0.327
-0.082
-20.11%
jan 1, 1996
0.183
-0.144
-43.96%
jan 1, 1997
-0.004
-0.187
-102.0%
jan 1, 1998
-0.139
-0.136
3.7K%
jan 1, 1999
-0.129
+0.011
-7.77%
jan 1, 2000
0.081
+0.209
-162.87%
jan 1, 2001
0.432
+0.352
434.99%
jan 1, 2002
0.834
+0.401
92.84%
jan 1, 2003
1.164
+0.331
39.65%
jan 1, 2004
1.377
+0.213
18.3%
jan 1, 2005
1.418
+0.041
2.94%
jan 1, 2006
1.336
-0.082
-5.76%
jan 1, 2007
1.22
-0.116
-8.69%
jan 1, 2008
1.125
-0.095
-7.81%
jan 1, 2009
1.066
-0.059
-5.25%
jan 1, 2010
1.051
-0.015
-1.36%
jan 1, 2011
1.063
+0.012
1.13%
jan 1, 2012
1.084
+0.021
1.98%
jan 1, 2013
1.073
-0.012
-1.07%
jan 1, 2014
1.008
-0.065
-6.06%
jan 1, 2015
0.869
-0.138
-13.71%
jan 1, 2016
0.685
-0.184
-21.19%
Ranking of countries by current statistics by years


Comments: