29
/
en
AIzaSyAYiBZKx7MnpbEhh9jyipgxe19OcubqV5w
April 1, 2024
115511
Croatia
HRV
true
2
1
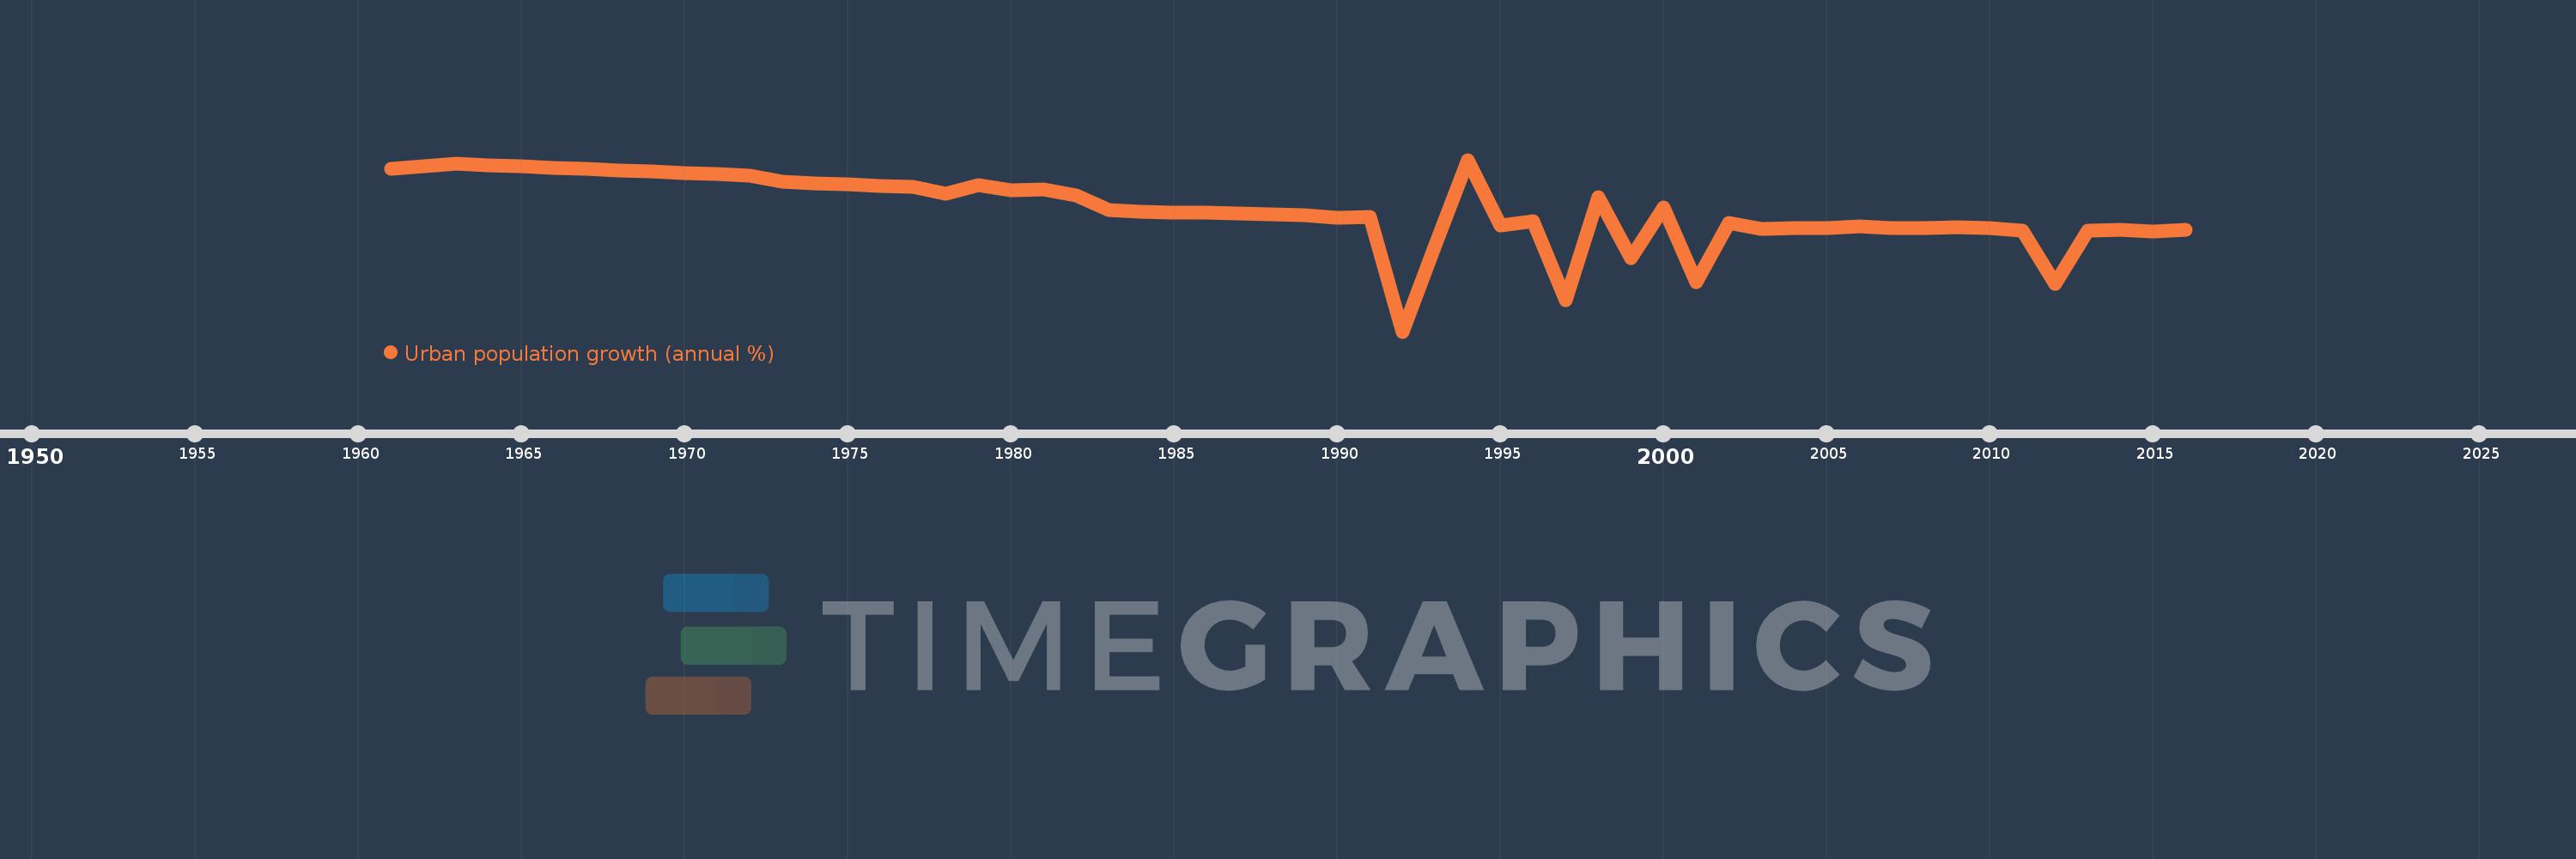
Urban population growth (annual %)
2016,2015,2014,2013,2012,2011,2010,2009,2008,2007,2006,2005,2004,2003,2002,2001,2000,1999,1998,1997,1996,1995,1994,1993,1992,1991,1990,1989,1988,1987,1986,1985,1984,1983,1982,1981,1980,1979,1978,1977,1976,1975,1974,1973,1972,1971,1970,1969,1968,1967,1966,1965,1964,1963,1962,1961
This statistics in other country:
AfghanistanAlbaniaAlgeriaAmerican SamoaAndorraAngolaAntigua and BarbudaArab WorldArgentinaArmeniaArubaAustraliaAustriaAzerbaijanBahamas, TheBahrainBangladeshBarbadosBelarusBelgiumBelizeBeninBermudaBhutanBoliviaBosnia and HerzegovinaBotswanaBrazilBritish Virgin IslandsBrunei DarussalamBulgariaBurkina FasoBurundiCabo VerdeCambodiaCameroonCanadaCaribbean small statesCayman IslandsCentral African RepublicCentral Europe and the BalticsChadChannel IslandsChileChinaColombiaComorosCongo, Dem. Rep.Congo, Rep.Costa RicaCote d'IvoireCroatiaCubaCuracaoCyprusCzech RepublicDenmarkDjiboutiDominicaDominican RepublicEarly-demographic dividendEast Asia & PacificEast Asia & Pacific (excluding high income)East Asia & Pacific (IDA & IBRD countries)EcuadorEgypt, Arab Rep.El SalvadorEquatorial GuineaEritreaEstoniaEthiopiaEuro areaEurope & Central AsiaEurope & Central Asia (excluding high income)Europe & Central Asia (IDA & IBRD countries)European UnionFaroe IslandsFijiFinlandFragile and conflict affected situationsFranceFrench PolynesiaGabonGambia, TheGeorgiaGermanyGhanaGibraltarGreeceGreenlandGrenadaGuamGuatemalaGuineaGuinea-BissauGuyanaHaitiHeavily indebted poor countries (HIPC)High incomeHondurasHong Kong SAR, ChinaHungaryIBRD onlyIcelandIDA & IBRD totalIDA blendIDA onlyIDA totalIndiaIndonesiaIran, Islamic Rep.IraqIrelandIsle of ManIsraelItalyJamaicaJapanJordanKazakhstanKenyaKiribatiKorea, Dem. People’s Rep.Korea, Rep.KuwaitKyrgyz RepublicLao PDRLate-demographic dividendLatin America & Caribbean Latin America & Caribbean (excluding high income)Latin America & the Caribbean (IDA & IBRD countries)LatviaLeast developed countries: UN classificationLebanonLesothoLiberiaLibyaLiechtensteinLithuaniaLow & middle incomeLow incomeLower middle incomeLuxembourgMacao SAR, ChinaMacedonia, FYRMadagascarMalawiMalaysiaMaldivesMaliMaltaMarshall IslandsMauritaniaMauritiusMexicoMicronesia, Fed. Sts.Middle East & North AfricaMiddle East & North Africa (excluding high income)Middle East & North Africa (IDA & IBRD countries)Middle incomeMoldovaMonacoMongoliaMontenegroMoroccoMozambiqueMyanmarNamibiaNauruNepalNetherlandsNew CaledoniaNew ZealandNicaraguaNigerNigeriaNorth AmericaNorthern Mariana IslandsNorwayOECD membersOmanOther small statesPacific island small statesPakistanPalauPanamaPapua New GuineaParaguayPeruPhilippinesPolandPortugalPost-demographic dividendPre-demographic dividendPuerto RicoQatarRomaniaRussian FederationRwandaSamoaSan MarinoSao Tome and PrincipeSaudi ArabiaSenegalSerbiaSeychellesSierra LeoneSingaporeSint Maarten (Dutch part)Slovak RepublicSloveniaSmall statesSolomon IslandsSomaliaSouth AfricaSouth AsiaSouth Asia (IDA & IBRD)South SudanSpainSri LankaSt. Kitts and NevisSt. LuciaSt. Vincent and the GrenadinesSub-Saharan Africa Sub-Saharan Africa (excluding high income)Sub-Saharan Africa (IDA & IBRD countries)SudanSurinameSwazilandSwedenSwitzerlandSyrian Arab RepublicTajikistanTanzaniaThailandTimor-LesteTogoTongaTrinidad and TobagoTunisiaTurkeyTurkmenistanTurks and Caicos IslandsTuvaluUgandaUkraineUnited Arab EmiratesUnited KingdomUnited StatesUpper middle incomeUruguayUzbekistanVanuatuVenezuela, RBVietnamVirgin Islands (U.S.)West Bank and GazaWorldYemen, Rep.ZambiaZimbabwe Timeline:
This timeline shows a graph from 1961 to 2016 of Croatia. No data until 1960. Number of actual observations by date: 56.
Source name:
World Development Indicators
Source organization:
World Bank Staff estimates based on United Nations, World Urbanization Prospects.
Categories, topics:
Climate Change, Urban Development
Last updated:
apr 23, 2017
Indicators value changes by year
Minimum:
-5.268
jan 1, 1992
At the date of observation
Value
Absolute change
Change from previous value
jan 1, 1962
3.658
+0.158
4.52%
jan 1, 1963
3.776
+0.118
3.22%
jan 1, 1964
3.705
-0.071
-1.87%
jan 1, 1965
3.632
-0.073
-1.97%
jan 1, 1966
3.555
-0.078
-2.14%
jan 1, 1967
3.479
-0.076
-2.13%
jan 1, 1968
3.43
-0.049
-1.4%
jan 1, 1969
3.36
-0.07
-2.05%
jan 1, 1970
3.256
-0.104
-3.09%
jan 1, 1971
3.233
-0.023
-0.7%
jan 1, 1972
3.112
-0.122
-3.77%
jan 1, 1973
2.805
-0.306
-9.84%
jan 1, 1974
2.735
-0.07
-2.49%
jan 1, 1975
2.654
-0.081
-2.96%
jan 1, 1976
2.571
-0.084
-3.15%
jan 1, 1977
2.509
-0.062
-2.41%
jan 1, 1978
2.156
-0.353
-14.07%
jan 1, 1979
2.604
+0.449
20.81%
jan 1, 1980
2.365
-0.24
-9.2%
jan 1, 1981
2.371
+0.006
0.25%
jan 1, 1982
2.073
-0.297
-12.54%
jan 1, 1983
1.272
-0.802
-38.67%
jan 1, 1984
1.199
-0.072
-5.7%
jan 1, 1985
1.128
-0.071
-5.95%
jan 1, 1986
1.119
-0.009
-0.75%
jan 1, 1987
1.113
-0.006
-0.58%
jan 1, 1988
1.043
-0.07
-6.26%
jan 1, 1989
1.016
-0.027
-2.57%
jan 1, 1990
0.862
-0.154
-15.17%
jan 1, 1991
0.92
+0.058
6.74%
jan 1, 1992
-5.268
-6.188
-672.45%
jan 1, 1993
-0.634
+4.635
-87.97%
jan 1, 1994
3.987
+4.621
-729.38%
jan 1, 1995
0.469
-3.518
-88.23%
jan 1, 1996
0.661
+0.192
40.85%
jan 1, 1997
-3.567
-4.229
-639.45%
jan 1, 1998
1.973
+5.54
-155.31%
jan 1, 1999
-1.313
-3.286
-166.57%
jan 1, 2000
1.422
+2.735
-208.24%
jan 1, 2001
-2.601
-4.022
-282.93%
jan 1, 2002
0.564
+3.164
-121.68%
jan 1, 2003
0.271
-0.293
-52.0%
jan 1, 2004
0.293
+0.023
8.32%
jan 1, 2005
0.293
0.0
-0.09%
jan 1, 2006
0.403
+0.11
37.69%
jan 1, 2007
0.312
-0.091
-22.52%
jan 1, 2008
0.287
-0.025
-8.07%
jan 1, 2009
0.363
+0.076
26.49%
jan 1, 2010
0.296
-0.068
-18.65%
jan 1, 2011
0.18
-0.115
-39.07%
jan 1, 2012
-2.698
-2.878
-1.6K%
jan 1, 2013
0.167
+2.865
-106.2%
jan 1, 2014
0.211
+0.044
26.17%
jan 1, 2015
0.1
-0.111
-52.5%
jan 1, 2016
0.193
+0.093
92.77%
Ranking of countries by current statistics by years


Comments: